Weekly Math Poll – NBA Finals

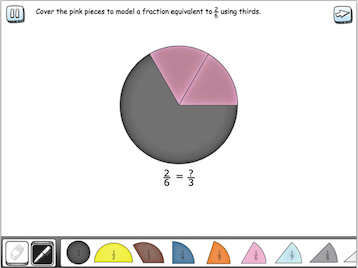
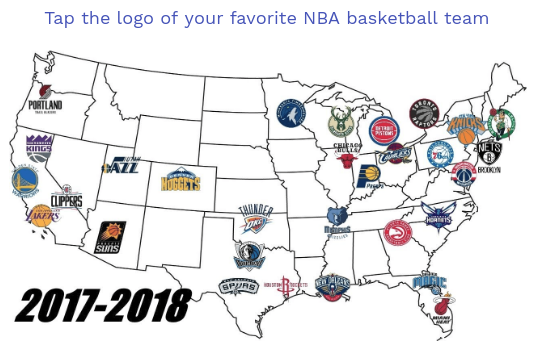
This poll covers mean, median and interquartile range. These are statistics concepts that show up in Algebra I and sometimes earlier. You could use it as a fun review/warm-up. Practicing questions that involve finding data in charts is always good SAT/ACT review. Alternately, it would be a great exit ticket for a day where you teach students about interquartile range. Also, feel free to copy it to your dashboard and modify the questions to better fit what your students are currently covering. Either way it is a great opportunity to tie in current events and basketball into math. Who knows, you may end up observing your students making data-driven arguments for or against one of the teams.

Map of NBA basketball teams
– Map of NBA basketball teams –

After Task 1, we dive in to the math. The next two questions involve some review of mean and median but the real challenge is in identifying the correct data to use. Students often know how to compute mean and median, especially when the data is presented clearly in the problem. Finding it in the table adds an extra challenge but also makes it more relevant and transferable to applying statistical analysis to authentic, real-world data.

Also, when you are reviewing student data from this poll, you can quickly see which students used the wrong data by using the custom legend. If they computed the mean correctly but for the wrong score (points scored by the Warriors or against the Rockets) they will be color coded in purple. If they mixed up mean and median but were otherwise correct, they will be coded in blue.

Custom Legend for Task 1
– Custom Legend for Task 1 –

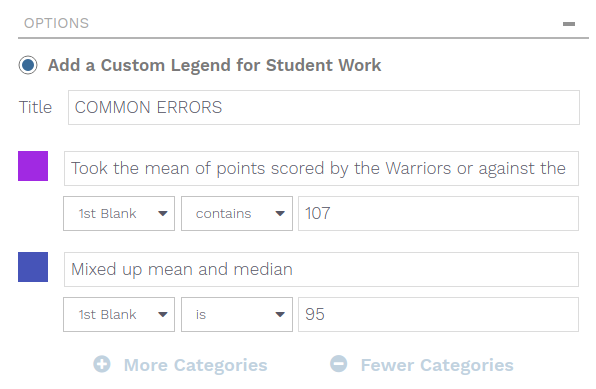
We also added a custom legend for tasks 3 and 4, we recommend you check them out before running the poll with your student.

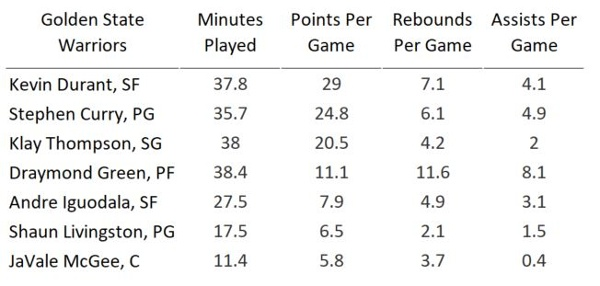
For all the questions, we give you real data that was current up until the start of the 2018 finals. Feel free to linger on one of these questions and ask your students what they notice.

Lebron James Stats
– Lebron James stats –

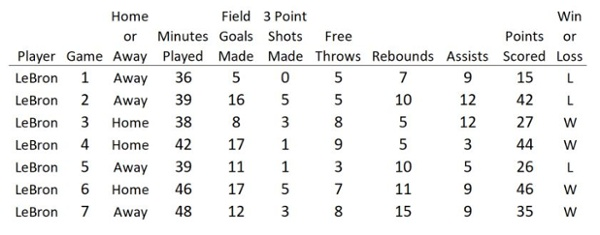
You can pause here and ask your students,

“Do you see a correlation between points scored by LeBron and if his team won or lost?”

“Does he tend to score more or less points when other statistics (rebounds, assists…) go up?”

You can also pause after the next question to ask them about how the points are distributed within a team.

Golden State Warriors Stats
– Golden State Warriors Stats –
After students do the analysis of the top 7 highest scoring players they have even more useful information. You can ask them, how do the distributions of the two teams compare? What are the outliers in the data? Hopefully your students use data and their statistics (mean, median, interquartile range) in their responses. If you are covering standard deviation, this problem’s prompt and correct answer can be quickly changed once in your account. Interestingly, the teams have very similar standard deviations when it comes to the top 7 point scorers. Whether you’re rooting for the Cavs or the Warriors, this poll will let your students compute statistics from real data that they can use to support their favorite (or talk trash about their rival). Get started by previewing the poll right now, or login to wootmath.com and search for NBA Playoffs in the Shared Gallery.

Visit our page on Formative Assessment for more information on implementing these strategies in your classroom.

Stay tuned for next week’s poll!

Weekly Math Poll – Star Wars Day

This poll highlights some features of designing quality tasks that we point out in this post. But, don’t worry, there are no spoilers here.

Task #1
The first task is a tap an image question about which character has been in the most Star Wars Films. If you are making a tap an image task like this, you need to be careful not to select the border for the answers. The answer is not Jar Jar Binks (thank goodness) but if it were, this is how you would select the acceptable region to not have overlap.

Which character has been in the most Star Wars Films?

– Tap an Image: Example of highlighting the correct answer –

If you shaded all the way to the edges, a student could select between Mace Windu and Jar Jar Binks and still get the question right. The way it is shaded above, students need to pick one face, not a border between them.

Task #2
Task 2 asks what AT-AT stands for. Again, the answer is NOT “a terrifying attack tank” but if it were, here is what that answer would look like:

Allow typos in student responses

– Allowing typos in student responses –

Notice how we allow 3 typos. In English class, spelling matters but for trivia we just want to know if they are close. Maybe your student spells terrifying with one ‘r’ and attack with one ‘t’. They would still get the answer correct… except the actually answer is not “A Terrifying Attack Tank”, it’s something a little less silly. Also, we have equivalence set to match words but not case so it is not sensitive to capitalization.

Task #4
Task 4 is a particularly fun one! This task actually has two correct answers, for multiple choice tasks you can select multiple correct answers. This is a great way to stimulate rich discussions with your students. If you run this poll with your class, we recommend you learn it first since this is a fun one to know ahead of time. Here’s a hint: one of the correct answers was the title of an early pre-production script.

Multiple choice with multiple correct answers

– Task 4: Multiple choice (with multiple correct answers) –

Task #5
Task 5 doesn’t need a picture but we find that pictures makes tasks more fun. Instead of having a simple multiple choice question you can liven it up with a fun picture like this.

Multiple choice with supporting image

– Task 5: Multiple choice with supporting image –

Task #8
For task 8 we use the equivalence setting to set a tolerance. For this problem it accepts answers that are within 31 from what we put as the correct answer. 

Setting a tolerance for student responses

– Setting a tolerance for student responses –

This is helpful for questions where you are not concerned about precision. If you don’t want to specify rounding conventions or you want an estimate, this tool can be quite helpful.

Task #9
For task 9 we used a picture as a hint. Even if you haven’t seen the specific episode, there is a chance you might recognize the lead character from the picture. Using pictures as hints can be helpful supports for problems that are a little bit of a stretch. They can also be helpful for language supports for your emerging bilingual students.

We hope you enjoy the trivia as much as we do. Good luck and may the fourth be with you!

Get started by previewing the poll right now, or login to wootmath.com and search for Star Wars Trivia Poll in the Shared Gallery.

Stay tuned for next week’s poll!

Weekly Math Poll – Solar Systems

Task #1
The poll starts with some simple linear modeling word problems to get your students warmed up. Students often struggle with word problems and I’ve found that adding in accessible, linear modeling problems can make them not seem so daunting. I also find that the scratchpad is a great place for language supports. Even if you don’t have any emerging bilinguals in your class, it is good to have a reminder of what we mean by ‘model’ so students are ready when it comes to test time.

Customized scratchpad with embedded language support

– Student scratchpad customized with embedded language support –

Task #3
Task 3 asks them to find the point when both homes will cost the same amount of money. This is a great problem to have students use the scratchpad to show their work. That way, you get more insight into how they are solving the problem and, if they get it wrong, where they went astray. I find the expression editor (the “Expr” tab) to be helpful for writing out my work.

Bookmarked student response

– Bookmarked student response –

Notice how I bookmarked this response “Great work using the scratchpad!” This means you can pull up and project this example to go over with everyone, even in different classes.

Task #4
For task 4, students are asked to explain if they think buying solar panels is a good idea or not and justify their reasoning. This lets students use math to make an argument and also bring in their values and lives outside of school. This can also be a good opportunity for you to show another representation of systems of equations, a table. Polls doesn’t have a three column table (yet) but you can make two tables that auto populate if you have x in one column title and an expression in terms of x in the other. This way you can present, as is done in the bookmarked response below, how tables help support the notion that after 20.8 years, it will be cheaper to have solar panels.

Bookmarked student response

– Using tables to help support answer –

We like how this question can be mathematized, but students can also give answers like “20 years is too long to wait” or “I wouldn’t want to spend $25,000 upfront” that are also valid and worth reviewing.

This poll gives your students a review of modeling linear relationships and provides you with valuable data on their understanding and procedural fluency with solving linear systems.

Get started by previewing the poll right now, or login to wootmath.com and search for Solar Systems in the Shared Gallery.

Visit our page on Formative Assessment for more information on implementing these strategies in your classroom.

Stay tuned for next week’s poll!

Woot Math in a 4th Grade Classroom

Fraction bar digital manipulatives
Fraction Circle Digital Manipulatives

– Digital Manipulatives –

Not having to search for a half, third, and sixth piece (that accidentally got knocked on the ground and now is under someone’s shoes, or what color was the twelves piece?!) To model a problem quickly and efficiently for a learner still at the concrete level of fractions is a teacher’s dream come true!

Woot Math provides an opportunity for students to have access to manipulatives and models of all sizes and types (fraction bars and circles are available to students) while working on problems that cover all grade level standards. This is exactly what I have always wanted to be able to provide for my students. The question types are varied with kid friendly fonts, graphics, and animations to keep students interested peeked. Additionally, the writing tool is fantastic for showing how to make groups, separate, divide, and give meaning to word problems – every kids’ nemesis. Woot Math has built in positive reinforcements and rewards to keep students engaged while offering rigorous common core aligned curriculum. Students are presented with problems that mirror our state test and their confidence is built as they see themselves as experts to help classmates working on similar question types.

Student engagement

– Student engagement includes badges and stars –

Like most classrooms across the nation, my class is composed of students performing multiple grade levels above and multiple grade levels below in math a well as other subjects. Woot Math is a perfect match for every student in our class. Students with IEPs are able to watch the instructional videos and receive curriculum starting with third grade standards. Students who are advanced in math can progress on their own above our grade level and continue to learn fractions and decimals into sixth grade level.

We use Woot Math in class for 15 to 30 minutes a day while we are working in the fractions domain. I assign each student to start at the beginning of the program, which is third grade standards. As a fourth-grade teacher it is a dream for me to have no assumptions of what the students remember from last year. Every child is able to work through last year‘s fractions and decimals standards. (You can find a useful example of Woot Math problems  on their Equivalent Fractions page.)

Woot Math gives students the opportunity for additional practice if they make mistakes, so mastery is the focus of each assignment. I love that Woot Math ensures that each student is able to be successful before moving on. The focus is on mastery, not on getting the assignment completed as fast as possible. If students rush through with careless errors they are given more opportunities to try those problems again. Students learn that focus and accuracy are more important than speed. The immediate feedback students receive let’s them know right away if they are understanding the standards or not.

Completed Book Tile

– Completed Book Award –

Each week on Monday I set a goal for students to complete one or two “books” by Friday. I love that the curriculum is broken down into small parts so students are celebrated frequently and receive recognition for their hard work. Everyone feels like a winner with Woot Math. Kids love receiving a new highlight color and being awarded their stars at the end of a section. I reinforce to my class not to guess and to rewatch the video that comes at the beginning of the section which models, describes, and outlines exactly how to complete the work.

The Mastery by Books report is a quick way for me to scan who has completed which books and to what degree of mastery. The color-coded grid is simple, straightforward, and a breeze to use for the busy teacher with multiple subjects to teach a day. Being able to see 32 students work on individualized assignments that have been personalized to meet their needs is so rewarding. Every student is learning the next thing they need to know. That’s the power of Woot Math! Woot!

Adaptive Learning Reports

– Sample Report –

If you haven’t already, sign up for your free today!

About Christi:
Christi Tucker is a 4th grade teacher with her masters degree in curriculum and instruction. She has ten years of experience in preschool through 8th grade. Christi loves the Southern California sunshine, color-changing sheep on Minecraft, kayaking in the bay, and taking on a challenge to learn something new. Embracing change, she loves to integrate technology into learning and utilizing it to make learning an adventure everyday.

Weekly Math Poll – Systems of Inequality

Task #1
The context of the problem is a business that makes hats, both by machine and by hand. In the first problem, students need to model an inequality between their budget, $2000, and the cost of making each type of hat. Often students don’t know where to start with word problems, so this task provides some supports in the scratchpad. If you think your students don’t need the extra support, feel free to remove it by clicking on scratchpad settings after you have copied the task into your account.

Student view of task with scratchpad

Task #2
The next problem is another opportunity for them to model an inequality from a word problem. Some students may be able to intuitively see that if over 50% are made by hand then y>x. Others will need some help, so the scratchpad has some steps to get them working. When reviewing the problem with the class, you can always use this pre-saved bookmark called “Great Work!” (Note: you can access bookmarks by clicking on the “Bookmarks” tab when viewing results.)

Task #2 with steps illustrated on the scratchpad

Notice how the scratchpad helped the student get started with writing down what they know, then putting it together to solve the problem. If students write the final answer as y/(y+x)>0.5 (or any variation of it) they will get it right, make sure you go over that this is the same as y>x before the next problem.

Task #3
This is a great example of how you can spice up a multiple choice question. There is a pre-made graph and a blank table on the scratchpad to help them connect different representations of y>x.

Scratchpad with different representations of y>x

Task #4
This problem has the inequality from task 3 on the scratchpad. The major advantage of this is even if your students got it wrong in task 3, they won’t be building off a mistake moving forward. If you are running a teacher led poll, they won’t be able to look ahead. This task is harder than the last one, remember to remind them to use a table or plot some points. If you want, you can always add hints on the scratchpad by going to “Scratchpad Setting” when editing the task.

Scratchpad with inequality from previous task on the scratchpad

The final problem gives them practice with testing points in a system of inequalities while remembering the parameters of the original problem. Students are given a graph of the system of inequalities to help them draw connections between different representations. Remind them as they work that they can draw on the graph (using the scratchpad) to plot points and see which of the shaded regions they are in.

Get started by previewing the poll right now, or login to wootmath.com and search for Systems of Inequality in the Shared Gallery.

Visit the page on Formative Assessment for more information on implementing these strategies in your classroom.

Weekly Math Poll – Woot Math Can Do That?!

Even if you remember a childhood song for all fifty states, can you locate them all on a map? Mr. Ward created fifty different “tap” tasks to help students identify the locations of all fifty states. The “tap” feature is limitless, interactive and fun, and students love clicking on the correct answer and seeing their classmates answers appear as well.

How to make a “tap” question
This poll uses the “Tap an Image” task type. To create this one, Mr. Ward uploaded an image of the US showing all 50 states. Then he used the pencil to color in the correct area (shown in green. Note that you can also use the eraser to clean up any mistakes or uneven lines.)

Create a Tap-an-image task

What Students See
This is what the students see on their devices. Students catch onto the “tap” function extremely quickly. And it works great on tablets, smartphones and computers! In this case, you could even do it as a classroom activity by projecting it on your smartboard. On a computer, students will use the mouse to “tap” and then press submit. And on a tablet or smartphone, students just physically “tap” with their finger and press submit.

Student view

Showing the Results
Once everyone has submitted their answer, you can press “Show Results” to display the classroom results. You can choose to display the results in two ways.

First, you can show all of the student responses, but choose to hide the correct and incorrect answers. To hide the results, just uncheck the “Reveal Answer” button (located on the bottom right of the screen). The blue dots indicate the student responses – now let the great group discussions begin!

To display the correct and incorrect answers, click on the “Reveal Answer” button. The green dots mean “correct” and red dots mean “incorrect.” In this case, two students picked the states next to Alabama, common mistake!

Teacher view with reveal answers checked

As the teacher, how and when you share the results with the class is up to you. In the projected view, student names are not displayed, so everyone in the class can comfortably participate in the conversation without feeling the pressure to get the “correct answer”. Offline, you can analyze the results and see individual student responses (by question, by student, etc).

Calling all teachers of history, language arts, science, computer science, art history and many more! We would love to see how you utilize Woot Math in your classroom! (Note that there are already lots of Physics and Computer Science questions also in Woot Math. Check out the gallery for lots more examples.) Show us your best polls with your most engaging tasks! We are all eyes and ears! Thanks for the idea Mr. Ward.

Get started by previewing the poll right now, or login to wootmath.com and search for Geography in the Shared Gallery.

Weekly Math Poll – Fun with Factoring for Middle School

This Woot Math Poll was created by Marilyn. Thanks for sharing! To preview these excellent questions (there are 15 in total), run the poll now:

We’ve highlighed just a few fun questions. How would your students do on these?

Sample Task #1
This question asks the student to tap on any of the prime numbers shown below. You can use the Tap an Image task to make interactive tasks such as this – just upload any image and then color in the correct answer(s).

Tap on any prime number

Sample Task #2
This problem asks students to find a square number between 30 and 50. Students can use the scratchpad and the expression editor to show their work. A fun follow-up question – how many square numbers are there between 30 and 50!

Find a square number between 30 and 50

Sample Task #3
This question is a great review of mathematical vocabulary.

Modify for Your Classroom

You can use this poll as a warm up, quiz, or even homework. Or, you can copy and then modify it to meet your needs. There are lots of excellent ideas to leverage for your classroom. With Woot Math, all of the polls are completely free and great Open Educational Resources (OER).

Get started by previewing the poll right now, or login to wootmath.com and search for Prime Time Investigation in the Shared Gallery.

Visit our page on Formative Assessment for more information on implementing these strategies in your classroom.

Stay tuned for next week’s poll!

Happy Pi Day 3.14 – Quizzes & Resources

Pi Day celebrates the mathematical constant (π), as March 14 can also be expressed as 3.14, the first three digits of pi. Pi is the ratio of a circle’s circumference to its diameter, which is a constant. That is – for any size circle, the ratio is the same (π).

Happy Pi Day


The first large-scale celebration of Pi Day was organized by Larry Shaw at the San Francisco Exploratorium, where Shaw worked as a physicist. Then in March 2009, Pi Day became a national holiday in the United States. And a fun note? March 14th is also Albert Einstein’s birthday. Don’t worry, unlike Pi, this history lesson won’t go on forever. Onto the math!

Use these two warm-ups or exit tickets
for fun with square roots (and of course Pi):

Evaluating Square Roots    circumference warm-up

These two warm-ups can be used for a quick check
of student understanding with trigonometric expressions:

Evaluating cosine    special-right-triangles-in-unit-circle

And this is a great quiz for gauging
student understanding of arc length and sector area:

Arc length sector area quiz

You can run any of these as a warm-up, quiz or even assign for homework. You can also copy and modify the questions and make them your own. There are lots of excellent ideas to leverage for your classroom. With Woot Math, all of the polls are completely free and a great Open Educational Resources (OER).

Get started by clicking on any of the polls now to preview them, or login to wootmath.com and search by name. You can also click on the categories in the Shared Gallery – for example– GeometryTrigonometry, to find more great resources for your classroom. And who knows, you might also have fun with pie charts, or even pumpkin pie.

Weekly Math Poll – Review of Polygons

There are 21 fantastic questions created by a Woot Math teacher Alayna. Thanks Alayna for sharing this fantastic resource! Run the poll now:
Preview the poll to see all of the questions, but we’ve highlighed a few here to give you a sample.

Sample Task #1
This question asks the student to tap on the concave polygon. Using the Tap an Image task, you can upload any image and then highlight the correct answer.<
Tap the polygon that is concave.

Sample Task #2
And this question asks students to find the value of x, given the diagram below.

What is the value of x?

Sample Task #3
And one more – this one reviewing geometric terms.

Polygon vocabulary task
Modify For Your Classroom
You can run this as a quiz or assign for homework. Want to use it as a warm up? No problem – just copy and modify by selecting a couple of questions you want to cover. There are lots of excellent ideas to leverage for your classroom. With Woot Math, all of the polls are completely free and great Open Educational Resources (OER). Get started by previewing the poll right now, or login to wootmath.com and search for Polygons Review in the Shared Gallery.

Visit our page on Formative Assessment for more information on implementing these strategies in your classroom.

Stay tuned for next week’s poll!

Technology Tools for Elementary Grades

While there are no shortage of lists, they can be time consuming to parse and analyze. Organizations like Common Sense Media are critical (you can see their review of Woot Math here). Tracy Johnston Zager’s just posted her list, A Totally Not Exhaustive Look at the Current State of Elementary EdTech. We think her crtieria is a pretty good lens for analysis. It includes:
1. No time pressure. Some of the recommended apps have the option of timing or the option of disabling the timer. I recommend disabling the timer in all cases. If you can’t disable or mellow out the timer, don’t use the app.
2. Conceptual modeling. There are plenty of apps that have flashcards embedded in sushi restaurants, caves, junkyards, etc. But I’m looking for programs that relate the concepts of the number and operations to the fact. This usually means some form of visual modeling (arrays, dots, etc.).
3. Productive handling of mistakes. They’re opportunities to learn and should be framed as such. Also, competition is to be avoided for most students.
As she mentions, the list is not comprehensive. But it definitely includes some of our favorites, as well as some that are new to us. Thanks Tracy for the thoughtful list! And we are proud that Woot Math was included. You can read her full review here: http://tjzager.com/2018/03/06/a-totally-not-exhaustive-look-at-the-current-state-of-elementary-edtech/