How to play an assignment as a teacher?

There are a variety of ways to play as a student.

Formative Assessments

To run a quiz, exit ticket, warm up, or formative assessment as a student, you can:

  • Preview an assignment using the Preview button
  • Run the assignment in either self-paced or teacher-led mode. In either case, you can run the assignment with either a class roster or by typing your name when you join

Adaptive Learning

To run an Adaptive Learning as a student, you can:

  • Preview an assignment using the Preview button
  • Run the assignment as a student.

To run an assignment as a student, you will first need to create a sample student account. To do this, create a new student called Teacher from the Manage Roster tab on the teacher dashboard. You can either add the new student account to an existing class, or you can create a new class and then add a new student to the new class.

How much does Woot Math cost?

Much of the content in Woot Math is entirely free, and teachers can sign up for a free account here. There is no time limit to your free account, and you can use it with an unlimited number of classes and students.

Please visit the teacher pricing page for additional information on purchasing Woot Math as a teacher, or the district pricing page for additional information on purchase Woot Math for your school or district.

How do I assign my students work?

Assignments are used to send work to your students. Students access their assignments from the student dashboard. Once your students log in, then all active assignments are presented for them to complete.

When you generate an assignment for your students, different assignment options are available depending on the specific type of content you are assigning.

Adaptive Learning

Adaptive Learning content can be assigned to your whole class or individual students for differentiation. To select the Adaptive Learning content to assign, first click on the Content tab, then select Grades 3-7 under Adaptive Content to filter only the Adaptive Learning content.

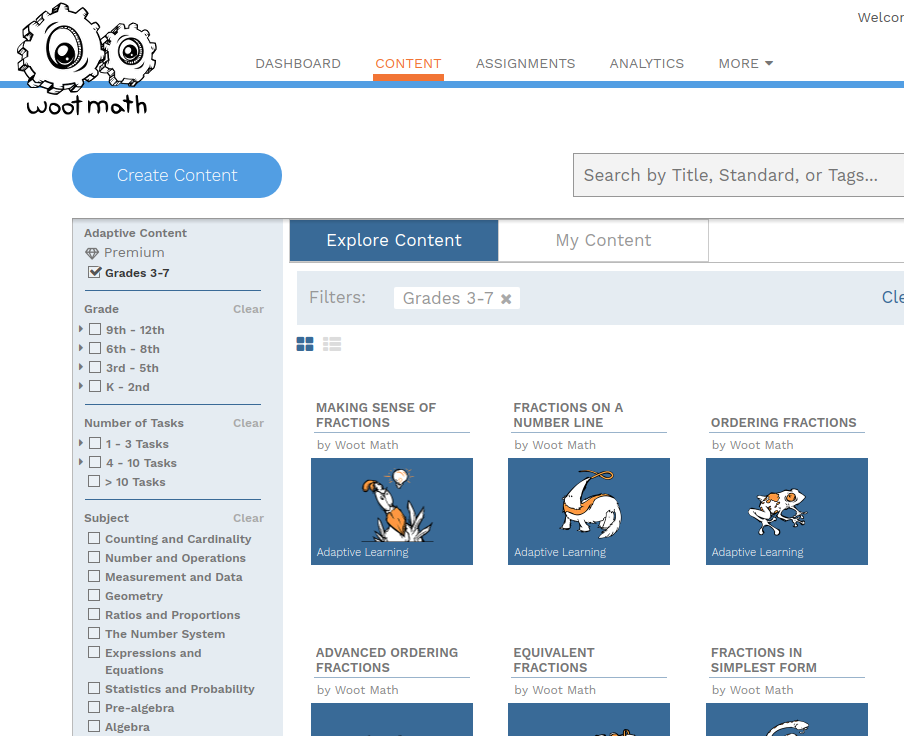
Hover over the desired content, and press assign. To make the assignment, press the Assign button.

Formative Assessment

Quizzes, Exit Tickets, Classwork/HW, Warm Ups, and more can be assigned to the whole class or individual students for differentiation. When you generate an assignment, you have the following options:

  • Teacher-Led: Designed for a teacher-led discussion, where you control the pacing and progression of the questions presented to the students.
  • Self-Paced: Designed as an independent activity, students work at their own pace solving the questions you have pre-selected for them.
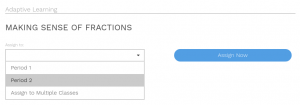
Assignment Options

To complete the assignment, you’ll want to specify which class(es) or student(s) the assignment is intended for. You can assign to an entire class, multiple classes, or to individual students for differentiation. To make an assignment for a specific class, select the class name from the drop-down menu. To make an assignment to multiple classes, select Assign to Multiple Classes from the drop-down menu.

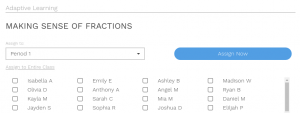
To assign to specific students, first select your class, press Assign by Student, and then select the student(s) that should receive the assignment.

Analytics

With all assignments, the Assignments section of the teacher dashboard displays the student progress for the assigned Adaptive Learning and Formative Assessments, and the Analytics section displays further results for the Adaptive Learning assignments.

Get Started

To add assignments for your students, log in to your teacher account now. Don’t have a teacher account yet? You can sign up for free here.

What content does Woot Math cover?

Woot Math provides tools for teachers in the math and STEM-related classrooms. It is appropriate for grades K-12+, and is aligned to both state and Common Core standards. Woot Math provides both Formative Assessment and Adaptive Learning content for teachers to utilize with their students:

Formative Assessment: Grades K-12+.  The formative assessments are designed to help you effectively leverage technology and identify gaps in student learning with real-time insights into trends, make student thinking visible, and bring joy (after all, Woot is in our name!) into the math classroom.

Adaptive Learning: Grades 3-7, intervention grades 8+. Help your students master critical concepts with the award-winning, research-based, interactive personalized learning platform that is proven to increase student outcomes.

Which grades is Woot Math appropriate for?

Woot Math is designed to be used with K-12+ classrooms. There are FREE grade-appropriate quizzes, warm-ups, exit tickets, polls and formative assessments that teachers can utilize today. Explore some of the free high-quality math- and STEM-based content here.

Woot Math also provides an Adaptive Learning platform for use as a supplement to your core curriculum, as well as intervention and remediation. The Adaptive Learning platform provides grade-aligned content for grades 3-7, and also as a supplement for grades 6-8.

Weekly Math Poll – 4th of July

We start the poll with a basic American history question asking which document was signed on the 4th of July, 1776. We expect nearly all your students will know the answer, regardless it is a great reminder of what we celebrate on this fine day.

Question 1 - Warm-up
– Question 1 - Warm-up –

Next, we move on to some math about a problem that that many of us encounter every year when planning a BBQ. The number of buns and the number of hot dogs just don’t match! We ask students to find the least common multiple of 6 and 8 to see just how big a party they would need to throw to have a perfect match.

Practicing problems with least common multiples…check. Thinking about food waste and business marketing… check. For added fun, ask your students to draw a picture to justify their reasoning or solve the problem in two or three different ways.

Least Common Multiple Problem
– Least Common Multiple Problem –

The scratchpad is also a great place to put reminders or fun facts relating to the problem.

The rest of this poll is aligned to Algebra I standards on modeling linear inequalities, graphing them and transforming them.

Tasks 3 and 4 have students imagine they are throwing a mini-firework show for their school and need to stay within the constraints of their budget and time expectations. If they get the math right, they will find that they do not have enough money to make the show long enough. If this were a real situation, these types of analysis would be helpful in arguing for a larger budget, lower permit costs or shorter time requirements.

Select the graph of an inequality
– Select the graph of an inequality –
Task 5 asks them to identify which graph is a solution to the inequality. I like making tasks like this with screenshots of actual graphs merged into one image for a tap-an-image multiple choice. The visual display of the heatmap can lead to some productive discussions in the classroom, especially if you have the “show answer” button turned off. If you do, the projected results will be a heatmap of student responses. This is a great time for a whole class or small group discussion (try the automatic grouping feature) about the task. If you want, you can create a copy of this task and then run it again after the discussion to see if everyone converges on the correct answer. Get started by previewing the poll right now, or login to wootmath.com and search for 4th of July in the Shared Gallery.

Visit our page on Formative Assessment for more information on implementing these strategies in your classroom.

Weekly Math Poll – NBA Finals

This poll covers mean, median and interquartile range. These are statistics concepts that show up in Algebra I and sometimes earlier. You could use it as a fun review/warm-up. Practicing questions that involve finding data in charts is always good SAT/ACT review. Alternately, it would be a great exit ticket for a day where you teach students about interquartile range. Also, feel free to copy it to your dashboard and modify the questions to better fit what your students are currently covering. Either way it is a great opportunity to tie in current events and basketball into math. Who knows, you may end up observing your students making data-driven arguments for or against one of the teams.

Map of NBA basketball teams
– Map of NBA basketball teams –

After Task 1, we dive in to the math. The next two questions involve some review of mean and median but the real challenge is in identifying the correct data to use. Students often know how to compute mean and median, especially when the data is presented clearly in the problem. Finding it in the table adds an extra challenge but also makes it more relevant and transferable to applying statistical analysis to authentic, real-world data.

Also, when you are reviewing student data from this poll, you can quickly see which students used the wrong data by using the custom legend. If they computed the mean correctly but for the wrong score (points scored by the Warriors or against the Rockets) they will be color coded in purple. If they mixed up mean and median but were otherwise correct, they will be coded in blue.

Custom Legend for Task 1
– Custom Legend for Task 1 –

We also added a custom legend for tasks 3 and 4, we recommend you check them out before running the poll with your student.

For all the questions, we give you real data that was current up until the start of the 2018 finals. Feel free to linger on one of these questions and ask your students what they notice.

Lebron James Stats
– Lebron James stats –

You can pause here and ask your students,

“Do you see a correlation between points scored by LeBron and if his team won or lost?”

“Does he tend to score more or less points when other statistics (rebounds, assists…) go up?”

You can also pause after the next question to ask them about how the points are distributed within a team.

Golden State Warriors Stats
– Golden State Warriors Stats –
After students do the analysis of the top 7 highest scoring players they have even more useful information. You can ask them, how do the distributions of the two teams compare? What are the outliers in the data? Hopefully your students use data and their statistics (mean, median, interquartile range) in their responses. If you are covering standard deviation, this problem’s prompt and correct answer can be quickly changed once in your account. Interestingly, the teams have very similar standard deviations when it comes to the top 7 point scorers. Whether you’re rooting for the Cavs or the Warriors, this poll will let your students compute statistics from real data that they can use to support their favorite (or talk trash about their rival). Get started by previewing the poll right now, or login to wootmath.com and search for NBA Playoffs in the Shared Gallery.

Visit our page on Formative Assessment for more information on implementing these strategies in your classroom.

Stay tuned for next week’s poll!

Weekly Math Poll – Systems of Inequality

Task #1
The context of the problem is a business that makes hats, both by machine and by hand. In the first problem, students need to model an inequality between their budget, $2000, and the cost of making each type of hat. Often students don’t know where to start with word problems, so this task provides some supports in the scratchpad. If you think your students don’t need the extra support, feel free to remove it by clicking on scratchpad settings after you have copied the task into your account.

Student view of task with scratchpad

Task #2
The next problem is another opportunity for them to model an inequality from a word problem. Some students may be able to intuitively see that if over 50% are made by hand then y>x. Others will need some help, so the scratchpad has some steps to get them working. When reviewing the problem with the class, you can always use this pre-saved bookmark called “Great Work!” (Note: you can access bookmarks by clicking on the “Bookmarks” tab when viewing results.)

Task #2 with steps illustrated on the scratchpad

Notice how the scratchpad helped the student get started with writing down what they know, then putting it together to solve the problem. If students write the final answer as y/(y+x)>0.5 (or any variation of it) they will get it right, make sure you go over that this is the same as y>x before the next problem.

Task #3
This is a great example of how you can spice up a multiple choice question. There is a pre-made graph and a blank table on the scratchpad to help them connect different representations of y>x.

Scratchpad with different representations of y>x

Task #4
This problem has the inequality from task 3 on the scratchpad. The major advantage of this is even if your students got it wrong in task 3, they won’t be building off a mistake moving forward. If you are running a teacher led poll, they won’t be able to look ahead. This task is harder than the last one, remember to remind them to use a table or plot some points. If you want, you can always add hints on the scratchpad by going to “Scratchpad Setting” when editing the task.

Scratchpad with inequality from previous task on the scratchpad

The final problem gives them practice with testing points in a system of inequalities while remembering the parameters of the original problem. Students are given a graph of the system of inequalities to help them draw connections between different representations. Remind them as they work that they can draw on the graph (using the scratchpad) to plot points and see which of the shaded regions they are in.

Get started by previewing the poll right now, or login to wootmath.com and search for Systems of Inequality in the Shared Gallery.

Visit the page on Formative Assessment for more information on implementing these strategies in your classroom.

Weekly Math Poll – Woot Math Can Do That?!

Even if you remember a childhood song for all fifty states, can you locate them all on a map? Mr. Ward created fifty different “tap” tasks to help students identify the locations of all fifty states. The “tap” feature is limitless, interactive and fun, and students love clicking on the correct answer and seeing their classmates answers appear as well.

How to make a “tap” question
This poll uses the “Tap an Image” task type. To create this one, Mr. Ward uploaded an image of the US showing all 50 states. Then he used the pencil to color in the correct area (shown in green. Note that you can also use the eraser to clean up any mistakes or uneven lines.)

Create a Tap-an-image task

What Students See
This is what the students see on their devices. Students catch onto the “tap” function extremely quickly. And it works great on tablets, smartphones and computers! In this case, you could even do it as a classroom activity by projecting it on your smartboard. On a computer, students will use the mouse to “tap” and then press submit. And on a tablet or smartphone, students just physically “tap” with their finger and press submit.

Student view

Showing the Results
Once everyone has submitted their answer, you can press “Show Results” to display the classroom results. You can choose to display the results in two ways.

First, you can show all of the student responses, but choose to hide the correct and incorrect answers. To hide the results, just uncheck the “Reveal Answer” button (located on the bottom right of the screen). The blue dots indicate the student responses – now let the great group discussions begin!

To display the correct and incorrect answers, click on the “Reveal Answer” button. The green dots mean “correct” and red dots mean “incorrect.” In this case, two students picked the states next to Alabama, common mistake!

Teacher view with reveal answers checked

As the teacher, how and when you share the results with the class is up to you. In the projected view, student names are not displayed, so everyone in the class can comfortably participate in the conversation without feeling the pressure to get the “correct answer”. Offline, you can analyze the results and see individual student responses (by question, by student, etc).

Calling all teachers of history, language arts, science, computer science, art history and many more! We would love to see how you utilize Woot Math in your classroom! (Note that there are already lots of Physics and Computer Science questions also in Woot Math. Check out the gallery for lots more examples.) Show us your best polls with your most engaging tasks! We are all eyes and ears! Thanks for the idea Mr. Ward.

Get started by previewing the poll right now, or login to wootmath.com and search for Geography in the Shared Gallery.

Weekly Math Poll – Fun with Factoring for Middle School

This Woot Math Poll was created by Marilyn. Thanks for sharing! To preview these excellent questions (there are 15 in total), run the poll now:

We’ve highlighed just a few fun questions. How would your students do on these?

Sample Task #1
This question asks the student to tap on any of the prime numbers shown below. You can use the Tap an Image task to make interactive tasks such as this – just upload any image and then color in the correct answer(s).

Tap on any prime number

Sample Task #2
This problem asks students to find a square number between 30 and 50. Students can use the scratchpad and the expression editor to show their work. A fun follow-up question – how many square numbers are there between 30 and 50!

Find a square number between 30 and 50

Sample Task #3
This question is a great review of mathematical vocabulary.

Modify for Your Classroom

You can use this poll as a warm up, quiz, or even homework. Or, you can copy and then modify it to meet your needs. There are lots of excellent ideas to leverage for your classroom. With Woot Math, all of the polls are completely free and great Open Educational Resources (OER).

Get started by previewing the poll right now, or login to wootmath.com and search for Prime Time Investigation in the Shared Gallery.

Visit our page on Formative Assessment for more information on implementing these strategies in your classroom.

Stay tuned for next week’s poll!