Happy Pi Day 3.14 – Quizzes & Resources

Pi Day celebrates the mathematical constant (π), as March 14 can also be expressed as 3.14, the first three digits of pi. Pi is the ratio of a circle’s circumference to its diameter, which is a constant. That is – for any size circle, the ratio is the same (π).

Happy Pi Day


The first large-scale celebration of Pi Day was organized by Larry Shaw at the San Francisco Exploratorium, where Shaw worked as a physicist. Then in March 2009, Pi Day became a national holiday in the United States. And a fun note? March 14th is also Albert Einstein’s birthday. Don’t worry, unlike Pi, this history lesson won’t go on forever. Onto the math!

Use these two warm-ups or exit tickets
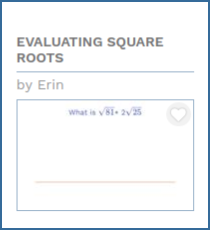
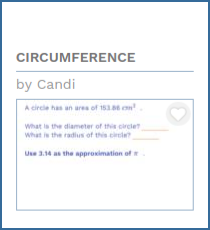
for fun with square roots (and of course Pi):

Evaluating Square Roots    circumference warm-up

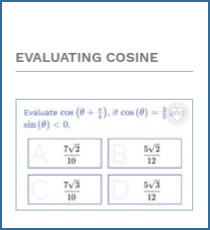
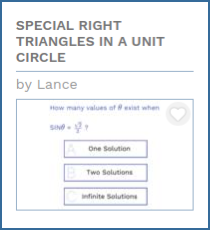
These two warm-ups can be used for a quick check
of student understanding with trigonometric expressions:

Evaluating cosine    special-right-triangles-in-unit-circle

And this is a great quiz for gauging
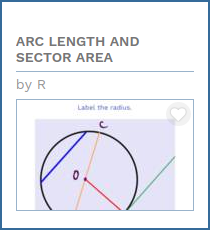
student understanding of arc length and sector area:

Arc length sector area quiz

You can run any of these as a warm-up, quiz or even assign for homework. You can also copy and modify the questions and make them your own. There are lots of excellent ideas to leverage for your classroom. With Woot Math, all of the polls are completely free and a great Open Educational Resources (OER).

Get started by clicking on any of the polls now to preview them, or login to wootmath.com and search by name. You can also click on the categories in the Shared Gallery – for example– GeometryTrigonometry, to find more great resources for your classroom. And who knows, you might also have fun with pie charts, or even pumpkin pie.

Weekly Math Poll – Algebra I Review

Weekly Math Poll – Algebra I Review

This week's math poll asks students to convert between forms of linear equations and explain their preferred strategy for finding a line through two points or a slope and a point.

Task #1

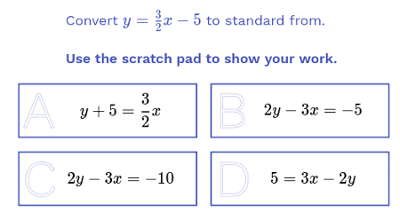
This task has students convert the given equation into standard form. Encourage your students to use the scratchpad to show their thinking!

Task 1 prompt

Task #2

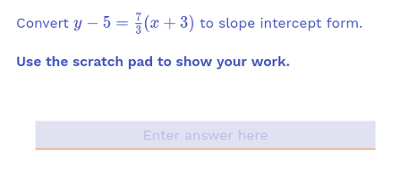
The next task has students convert the given equation into slope intercept form. Encourage them to use the expression editor, which makes it easy to work with and manipulate equations. 

Task 2 prompt

Task #3

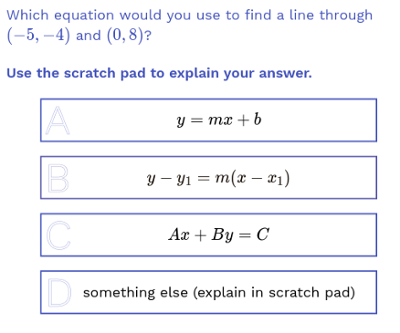
In the third task, students are asked to determine which equation they would use to find a line through the points (-5, -4) and (0,8). In this case students can choose from more than one answer – hence it is important to encourage them to show their work and strategy when solving the problem.

Task 3 prompt

Task #4

In the fourth task, students are asked to find a line with a slope of 5 through the point (0,8). Again, multiple answers are possible – so students should explain their work.

We encourage you to modify this task and content to align it with similar content. You can copy the poll and modify or delete any task and also make new ones. Please reach out with any questions or comments, we’re here to support you!

Get started by previewing the poll right now, or login to wootmath.com and search for the Algebra I Review poll in the Shared Gallery.
Visit our page on Formative Assessment for more information on implementing these strategies in your classroom. Stay tuned for next week’s poll!

Why Fractions Matter and How Woot Math Can Help

Why Fractions Matter and How Woot Math Can Help

We know many students struggle to master fractions, and yet until recently, we didn’t know the full extent of the cost. From recent research, it is clear that facility with fractions is critical to higher mathematics and other advanced STEM fields.
As Dr. Robert Siegler and his colleagues found:
“A child’s knowledge of fractions in fifth grade predicts performance in high-school math classes, even after controlling for IQ, reading achievement, working memory, family income and education, and knowledge of whole numbers.”
Fractions: The new frontier for theories of numerical development.
— 2012, Siegler, R. S., Fazio, L. K., Bailey, D. H., & Zhou, X
With a slew of similar findings, it is clear that knowledge of fractions matter. The National Math Panel said it clearly in 2008: “…knowledge of fractions is the most important foundational skill not developed among American students.” Lack of this foundational skill remains equally evident in recent national testing. And yet, imagine the difference it would make if you could ensure that all students had the fluency with rational numbers we know they need to succeed. Woot Math supports you in making this difference. Teachers that use Woot Math report that it consistently increases both confidence and mastery of rational numbers. In only a few hours of use, teachers see measurable improvements in student performance. Here are a few specific ways that Woot Math’s personalized learning platform can help you ensure your students have the foundation they need to succeed.

We Support You In Your Instruction

Woot Math Adaptive Practice is designed to support a range of implementations. You can assign topics as part of an in-class rotation, for 1-on-1 instruction, or for further practice. The learning platform interleaves short-form instructional videos with engaging interactive problems. An easy to use teacher dashboard is provided so that you can monitor each student‘s progress, report on outcomes, and assign new topics. Woot Math typically recommends two to four sessions per week, 20 to 30 minutes per session (learn more about our implementation guidelines for elementary school and middle school students).

Content Is a Key Differentiator

Woot Math leverages learning sciences’ leading research on teaching rational numbers. “Adaptive technology can only be effective if it leverages quality supplemental content,” says Krista Marks, Woot Math CEO in Fractions Unlocked: Why Fractions Matter and how technology can help. Our fraction content is informed by decades of research in fraction education from organizations like the Rational Number Project. With funding from the National Science Foundation, we have demonstrated efficacy and effectiveness using Woot Math.

Digital Manipulatives Build Fluency

The ability to work with digital models has proven effective in developing conceptual understanding of fractions. Students need to experience making connections among different representations in order for them to make sense of fractions. In Woot Math, students are exposed to a wide variety of models, including fraction circles, fraction bars, number lines, set models and more. As students gain experience and exposure to a variety of models, they develop the strong mental images that they will need to succeed in math. Beth Wycoff, using Woot Math with all her 5-7th grade students, found:
“Woot Math has given me a practical and efficient way to take students individually from concrete to abstract understanding of fraction concepts. Students are able to construct fractions and visualize the problems they are solving.”

Adaptive Learning Platform

The promise of adaptive technology is the ability for software to tailor content to each individual student’s needs. But not all adaptive platforms (also known as personalized learning environments) adapt in the same way. In fact, there are huge variations in the adaptivity and recommendations that these systems can make. The Woot Math platform analyzes student work – not just a right or wrong answer – but their actual interactions with the models, manipulatives, and scratchpad. Because the adaptive platform understands the student’s interaction with each problem, it can make much more targeted decisions about what the student knows, what the student doesn’t know, and what gaps to help remediate. From our NSF-funded research, we know that our adaptive platform has shown dramatic improvements in student learning. Get your students started today!

Want to Learn More?

Dr. Terry Wyberg of the Rational Number Project provides tangible advice and practical tips for helping your students develop number sense in his article, Adding Fractions: Unlocking Confidence & Flexibility.
WeeklyMath Poll – Hybrid Car

WeeklyMath Poll – Hybrid Car

Do your students still struggle with word problems? Do they ever ask you “when are we going to use this in the ‘real world’? If so, we’ve got the poll for you! This poll helps guide students through building linear equations that model the cost of two different cars over time, one hybrid-electric, one regular. This post highlights how polls can help you scaffold a problem and also how to use the scratchpad in combination with the prompt in rich math tasks.

Task #1
The first task presents a word problem with two data points, one where the tank has a full 10 gallons and one where it has 8 gallons a month later. 

Tap on the car with the higher purchase price

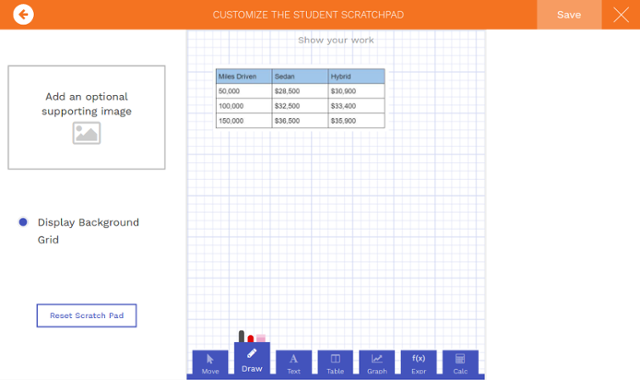
The first task asks us to compute which car has a lower purchase price. In the scratchpad, I have pasted a picture of a table of values relating to lifetime cost and miles driven. Students can draw on this table or use any of the scratchpad features to compute the cost at 0 miles driven.

Customize the student scratchpad
Since this problem asks students to figure out which car has a higher purchase price, students need to use the data to find how much the lifetime cost increases for every 50,000 miles and then work backwards to find the price at 0 miles. After students respond, I recommend displaying the results and then having a quick discussion to go over strategies and make sure they all were using a valid method. Students could get the right answer by just looking at the data for 50,000 miles instead computing it for 0 miles. I recommend making sure that students see how to compute that the purchase price of the Hybrid was 28,400 and the purchase price of the Sedan was 24,500. This will be helpful for the next problem where students were asked to model each car with a linear equation.

Task #2
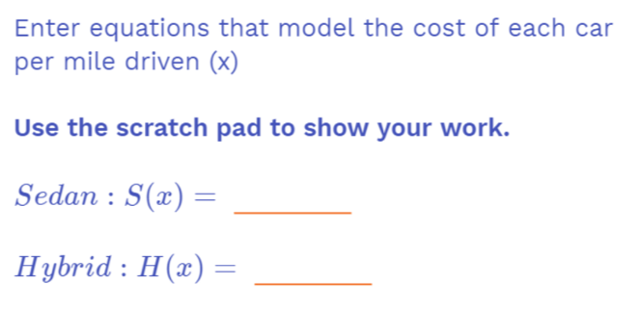
Task 2 problem statement

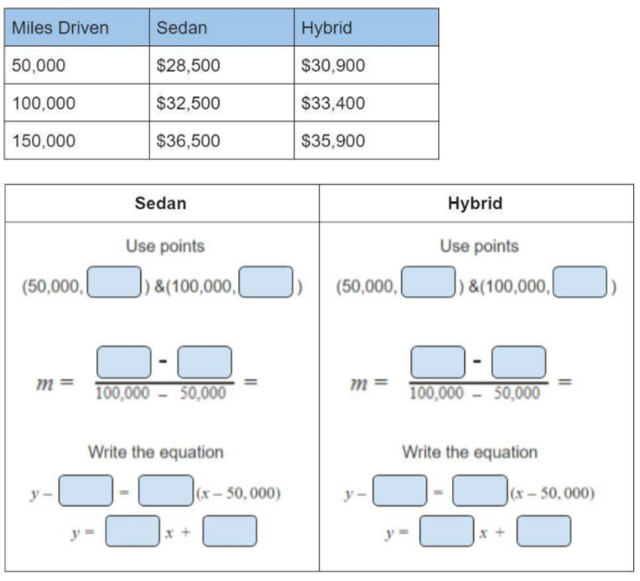
The scratchpad provides helpful support here in the form of a guided worksheet. Students can fill in the blank like they would in a workbook but now the answers are recorded digitally for you to analyze and organize. If you have students that want to solve it a different way or if they need more space, they can always move or delete the images. If you want use guided worksheets while making your own task, all you need to do is take a picture or scan of a worksheet and upload it in the scratchpad for your task.

Support materials added to student scratchpad

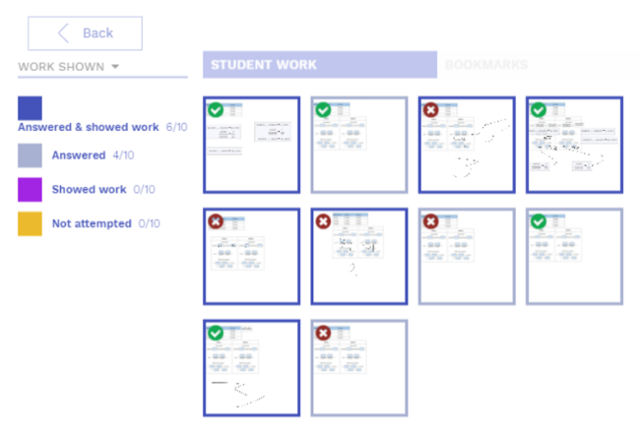
If you are worried that your students might not be filling out the worksheet and just peeking at their neighbor’s screen or using other unsanctioned resources, you can always sort responses by work shown. In the example below, four students did not show any work and two of them still got it right, suggesting it might be worth following up with them after class.

Using the Work Shown legend

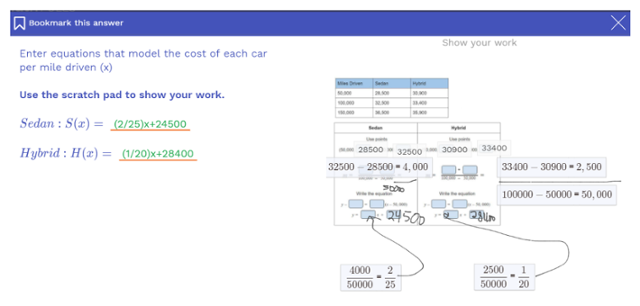
For the students who got the task right and showed work, if any of them did a particularly nice job showing their work, you can pull up their response as an exemplar to show the class. You can even save it in the bookmarks (upper left) to show other classes in the future when you run this poll. Notice how this anonymous student used the text editor, the calculator feature and the drawing tool to show their work.

Previewing excellent student work

Task #3
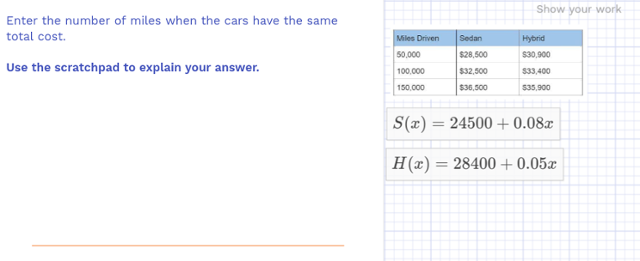
The third and final task in this poll shows how we can use the scratchpad to hold more information like the answer to a previous problem that is used in a subsequent problem. For a teacher led poll, students will not see these equations until after everyone is done with task 2. Note that if you run this poll in student-led mode with the “students see results” set to never, students could go back on their own and change their response.

Scratchpad with additional information

This poll ends with a question asking them to self evaluate how confident they are in this material, this is a great way to check in and gauge your students while also giving them a valuable opportunity to self evaluate.

This poll helps give some structure to modeling a linear relationship from a word problem and solving a system of linear equations. The scratchpad can help scaffold student work while also providing useful data for you on how they are working through each problem. This scratchpad feature turns polls turn into digital worksheets where students are guided through the intermediate steps. Stay tuned for next week’s math poll where we discuss some exciting new scratchpad features!

As always, we encourage you to modify these tasks and content to align them with your instructional goals. Copy the poll, modify or delete any task, or add new tasks. Please reach out with any questions or comments, we’re here to support you!

Get started by previewing the WootPoll right now, or login to wootmath.com and search for the Hybrid poll in the Shared Gallery.

Visit our page on Formative Assessment for more information on implementing these strategies in your classroom.

Stay tuned for next week’s poll!

Weekly Math Poll – Fish Tank

Weekly Math Poll – Fish Tank

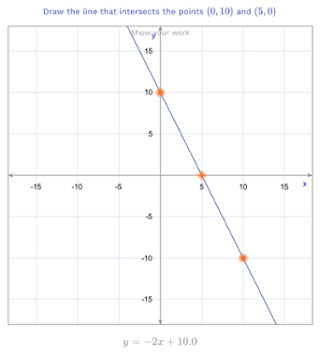
This week, we are focusing on how to use features in Woot Math to offer support to students who might be struggling on a given task. This week’s WootPoll uses the context of a fish tank to have students model a linear equation, find the x- and y-intercepts and construct a graph. This poll is quicker than previous weekly WootPolls and can be used as an exit ticket or warm up.

Task #1
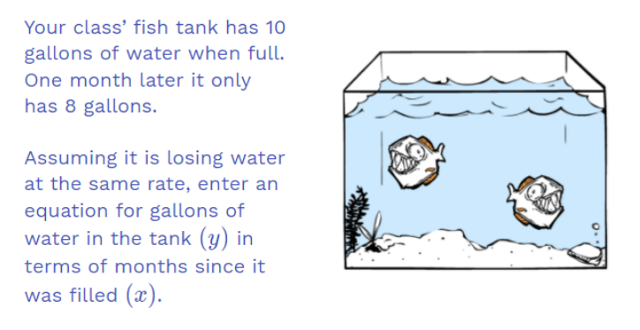
The first task presents a word problem with two data points, one where the tank has a full 10 gallons and one where it has 8 gallons a month later. 

Fish Tank problem statement

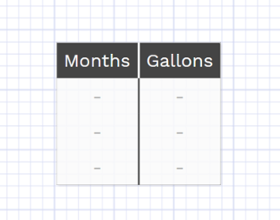
Some students will see the rate of -2 gallons per month and be able to translate that to the term -2x. Other students may struggle with how to get started. We encourage you to suggest they use the scratch pad to create a table of values for months and gallons. Then students can extrapolate what would happen after 2 months, 3 months, ect. If you think most students will need this support, you can go to scratchpad settings and add the table into the scratchpad so it will show up in every students’ scratch pad.

empty table
The custom legend for this task will also help you identify, among the students who did not get the question right, who is getting the correct slope, the correct intercept or forgetting the negative for the slope. This can help you give rapid feedback and recognize trends in your students’ errors.

Task #2
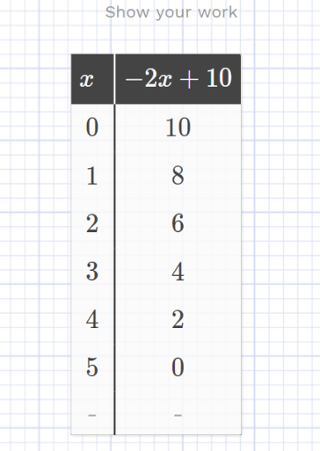
The second task asks students to fill in the blanks for the intercepts of y=-2x+10. If students are struggling to compute the intercepts analytically, you can have them use the scratch pad to create a table of values. When there is an expression on the right side header of the table, the table will auto compute the value of that expression. You can create a table that is placed in every student’s scratch pad so they can test points to see what -2x-10 equals for different values of x. In the example below, the values of -2x+10 are automatically computed based on the values of x that are entered.
Table with formula

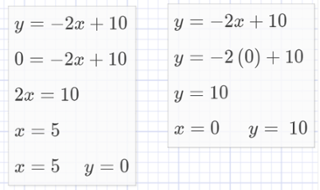
Students can also use the scratch pad to write out how they compute the x and y intercepts analytically. This can be a great reminder for students about showing their work.

Show work with the Expression Editor

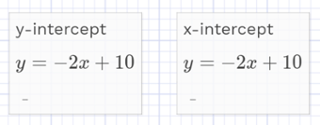
If students need more support, you can save the expression, written out with a header for y-intercept and x-intercept, directly on to their scratchpad. This can be a helpful reminder for your students and will help them keep their work organized.

Task #3
The final task asks the students to draw a line using the x- and y-intercepts. This task has an option enabled that displays the equation of the students’ graph as they manipulate the line. Students can see when they have the line matched up to the equation y=-2x+10.

We encourage you to modify these tasks and content to align them with your instructional goals. Copy the poll, modify or delete any task, or add new tasks. Please reach out with any questions or comments, we’re here to support you!

Get started by previewing the WootPoll right now, or login to wootmath.com and search for the Fish Tank poll in the Shared Gallery.

Visit our page on Formative Assessment for more information on implementing these strategies in your classroom. Stay tuned for next week’s poll!

Weekly Math Poll – New Job

Weekly Math Poll – New Job

This week’s math poll uses the context of a new job and commute costs to learn about systems of equations, functions and linear equations. Students model various situations based on hours worked and price of commute. This poll ends with an opportunity for students to use their computations to make value judgements about if they think the benefits outweigh the costs.

Task #1

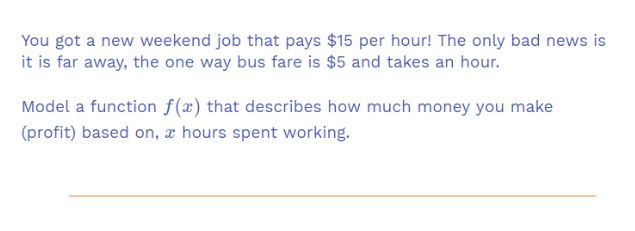
New job description

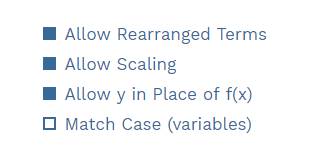
The first task asks students to make a function that models profit per hour, taking into account the $10 of bus fare. In addition to being a relevant context that will help you answer the inevitable question of “When am I ever going to use this in ‘real life’?”, this task highlights two features of Woot Math Polls, equivalence and custom legends of common responses. The short answer task is designed to accept multiple versions of any correct answer. If your students write f(x)=-10+15x they will still get it right; the same goes for y=15x-10 and y+10=15x. We even allow scaled versions of the equation, although it would be unlikely that a student would write 2y=30x-20, though they would still get it right. If you want to change any of the equivalence options, simply open the task and click on the gear icon, the following menu will appear:

Equivalence settings

If you don’t want to accept y in place of f(x) you can deselect it. If you don’t want to accept X in place of x (we recommend not making it case sensitive since some keyboards automatically capitalize) you can select the “Match Case” option. Scaling lets you accept larger and smaller versions of equivalent equations.

The prompt asks for the function to be written as f(x) but we decided to allow y as well for correct answers since if the student is getting this close, they are doing the math right and can get feedback later on which form to put it in. But wouldn’t providing this feedback be tedious and hard to scale to my 30+ students?

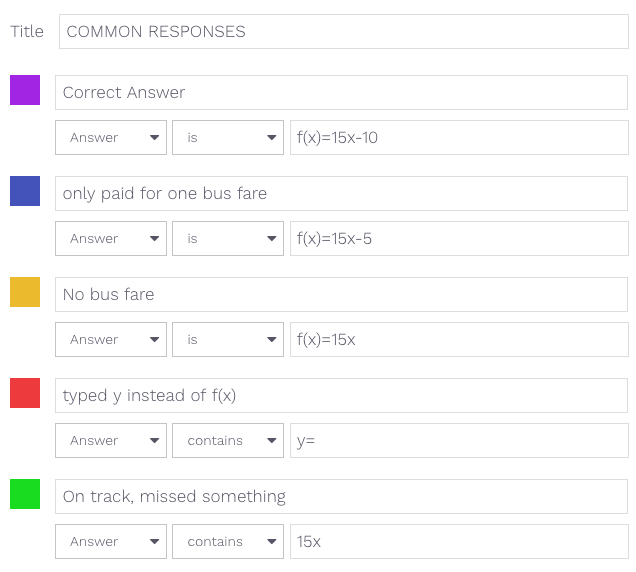
I’m glad you asked. That’s where the custom legend comes in. Student responses are automatically categorized based on a custom legend that can be tailored to each problem. This task has the following custom legend:

Custom Legend settings

The custom legend looks from the top down so it is important to have the correct answer first. If they did not account for the return bus fare, their response will show up blue on your dashboard. If you want them to have feedback about f(x) vs y without telling them they are wrong you can see who typed y in their answer (regardless of if they were correct) and remind them to pay attention to the prompt. If you want to praise students for getting close by correctly modeling the rate, you can see those responses in green. By automatically categorizing your responses, this task helps you provide more nuanced feedback and move your students learning forward.

Task #2

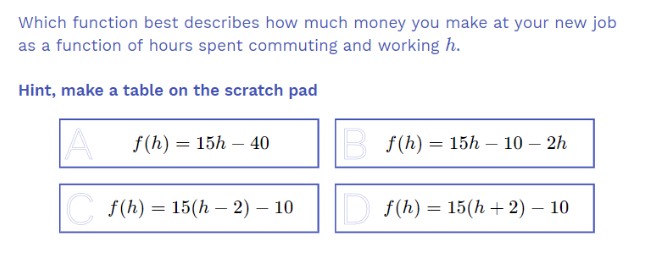
The next task has students model the same relationship but as a function of total hours, h instead of hours worked, x. In this case, h=x+2 so replacing x with h-2 will get you the correct answer.

Task #2 statement

But wait! Isn’t f(h)=15h-40 equal to f(h)=15(h-2)-10? Yup! That’s why this task has no assigned correct answer. After students respond you can display the results and have them discuss (in groups if you want) what they all think the correct answer is. Also, if students finish early, you can ask them to find the other correct answer as a challenge. This task also provides an opportunity to review equivalence and distribution.

Task #3

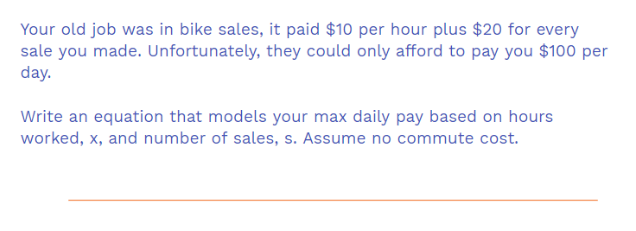
Task #3 Description

In the third task, students model an old job where they made a commission of 20 per sale plus $10 per hour but are maxed out at $100 per day. This task, when combined with the next one gives them more opportunities to work on modeling and also adds some variables that take value judgements and let them connect their own out of class experiences. How hard is it to sell a bike? If you sold a lot, would it be worth it to go home early? How many hours a day do you want to work?

Task #4

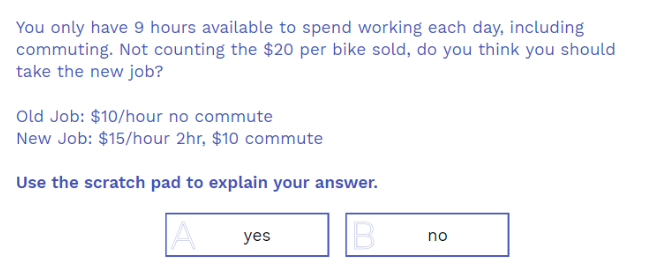
Task #4 Description

The final task has them compute the convergence point of the two jobs. This gives them more data to address the question of if they should take the new job or not. There is no correct answer but you can expect student responses to pull in topics ranging from how many hours they want to work, if they like bus rides or not, if they had a car or carpooled if it would be shorter, and if they value having a higher wage more than convenience.

We encourage you to modify this task and content to align it with similar content. You can copy the poll and modify or delete any task and also make new ones. Please reach out with any questions or comments, we’re here to support you!

Get started by previewing the poll right now, or login to wootmath.com and search for the New Job poll in the Shared Gallery.

 
Visit our page on Formative Assessment for more information on implementing these strategies in your classroom. Stay tuned for next week’s poll!

Weekly Math Poll – Head Start

Weekly Math Poll – Head Start

Welcome to our first #WeeklyMathPoll. These are designed to help stimulate discussions about mathematics while giving you valuable data on your students’ thinking. You can use it as a warm-up, exit ticket or build an entire lesson off of it. Feel free to copy the poll to your account and modify as you see fit. If you want help aligning it to a different grade level, tweet at us @WootMath or email polls@wootmath.com.
Head Start
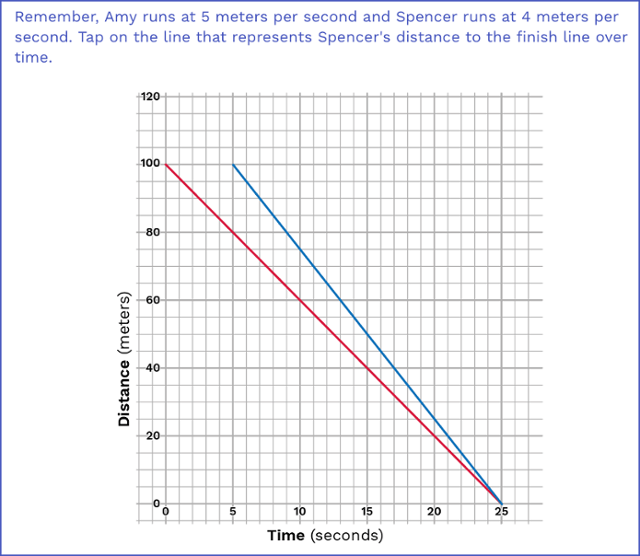
This week’s math poll is a problem about a foot race between Amy and Spencer. The poll is aimed at getting students to think about multiple solution paths to this rates problem. The answer can be given in either distance or time for the head start. Also, feel free to discuss questions like acceleration time or assigning different start locations to make the race close. 
Initial Problem Statement

The first question accepts answers with or without units (we want to give more entry points for success, feedback on units can come separately). If you want to assess the units, feel free to modify the accepted answers or create a task that asks them what the units should be if the answer is 20. You can also review student work and praise someone for getting the right answer, then praise someone else for using the right units.

This task also has a custom legend of common responses so if a student gets the number correct but spells the unit word wrong, they will be coded as blue (misspelled seconds but still had a 5 in their answer) or yellow (misspelled meters but still had a 20 in their answer). This can let you decide how important spelling is and distinguish spelling fluency from mathematical fluency. Better data means better feedback.

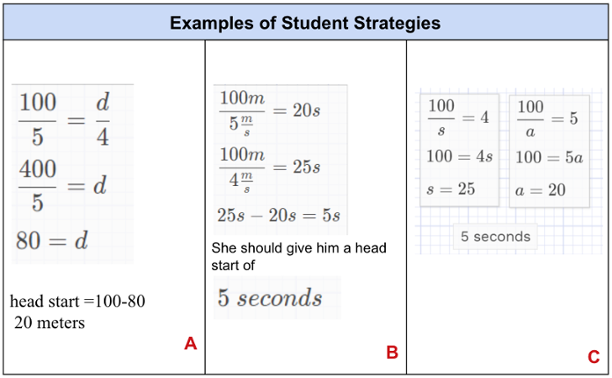
The following table also presents some examples of student strategies for task 1. Student A has given the correct answer in meters, shown their work and used fractions to solve the problem. Student B has divided the distance by each rate to find the time for each to finish. Student C has done similarly but using s for Spencer’s time and a for Amy’s time.

We encourage you to use the display student work feature to review examples in a whole class setting. This lets students see that they are not alone and that others can make similar errors or take different but also valid approaches to the same problem.

The next task asks them to tap on the line that represents Spencer’s distance to the finish line over time. Answers close to the convergence point are not accepted because we want students to select an answer where we know which line they mean, not one answer that could be interpreted as multiple lines.

Graph of Race

This task also has the opportunity for you to discuss what would happen if you extend Amy’s line (the blue one) back to the y-intercept. A great question for students who aced this: “If you want them to start at the same time how many meters from the finish line does Amy need to start?” Specify that this is not a head start, it actually means they run different distances so it is more of a handicap than a head start.

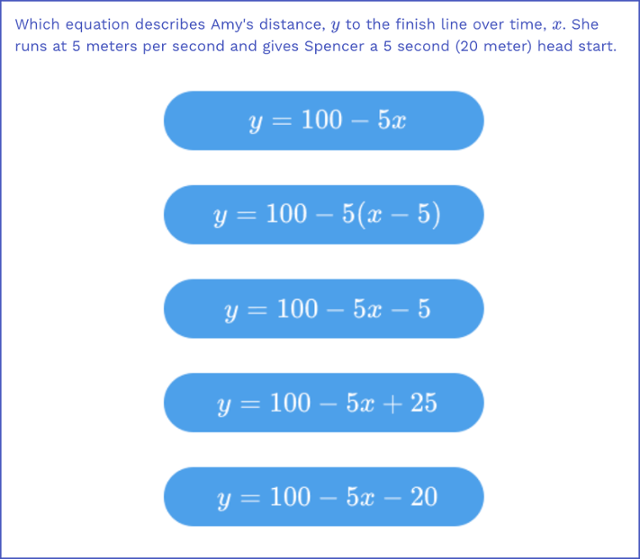
The final task has two correct answers, B and D. This is designed as an opportunity for you do have a discussion about why they are both correct. You can talk about how B represents a 5 second delay for Amy and how D represents a race where Amy has to run an extra 25 meters. Students might choose E because of the head start of 20 meters or C because of the 5 second head start.

If a student selects one correct answer, you can ask them to find the other correct answer. You can also present equation B as a horizontal transformation of equation A. This task also goes well with the grouping feature. You can create groups of 2-5 that are assigned randomly, homogeneously or heterogeneously based on correctness of the last response. For this task, students can discuss why they chose the equation they did and hear the perspective of others. If you want a re-vote, simply duplicate this task and they can take it over again after discussion. We encourage you to modify this task and content to align it with similar content. You can copy the poll and modify or delete any task and also make new ones. Please reach out with any questions or comments, we’re here to support you! Get started by previewing the poll right now, or login to wootmath.com and search for the Head Start poll in the Shared Gallery. Visit our page on Formative Assessment for more information on implementing these strategies in your classroom. Stay tuned for next week’s poll!

Citations

Wiliam, D., & Thompson, M. (2008). Integrating assessment with instruction: What will it take to make it work? Future of assessment: Shaping teaching and learning.