We must do more than teach math

We must domore than teach math.

It no longer feels okay to be silent. As I watch the events in Minneapolis, Louisville and Brunswick unfold, I am filled with sadness, anger, and an urgency to do more.

Dr. Robert Berry, someone I have long admired, a beloved education professor, a past president of NCTM, a Black man, recently posted:

"To my mathematics educators, We Teach More Than Mathematics. We must engage in anti-racist and trauma-informed education in our daily practices...BTW, I’m not OK."

At Woot Math, our work is focused on helping teachers ensure that all students have the math foundation they need to succeed. But Dr. Berry is right. We must do more than teach math. We must work to ensure that Black students have access not only to a safe and welcoming place to learn but also a safe and welcoming place to live.

The truth is they don’t. In our country, they never have. While we have repeatedly been shaken by the brutality captured on video, the reality is that for the Black community this is not new.

As we strive to figure out how to do more, we have begun by financially supporting the Center for Policing Equity (CPE), an organization at the forefront of addressing bias in policing. I greatly admire the work of Dr. Tracie Keesee, a remarkable leader, who is the co-founder of CPE, former Deputy of Training at NYPD, and a retired 25-year verteran of the Denver Police Department.

We also plan to read, listen, and learn from our Black colleagues, leaders, friends. We will identify ways that we can support and amplify their voice, their power. They are not alone. We stand and act in solidarity with them.

Krista Marks, CEO, Woot Math

June 3, 2020

What do the various mastery levels – red, yellow, green – imply?

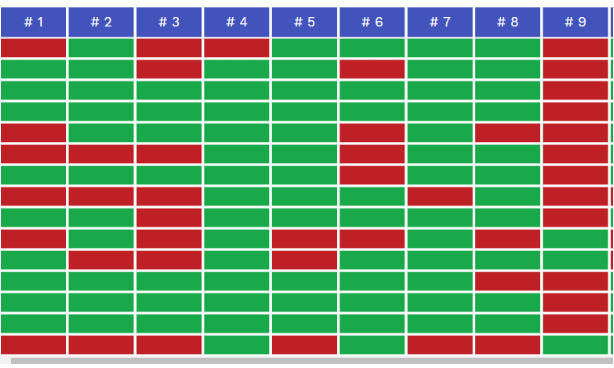
Woot Math uses a knowledge model of each student to help them be successful as they work on their Woot Math Adaptive Learning assignments. The knowledge model knows what each student has mastered, and where they are lacking. To review student data, start from the Analytics tab of the teacher dashboard. A screenshot of this report is included below.

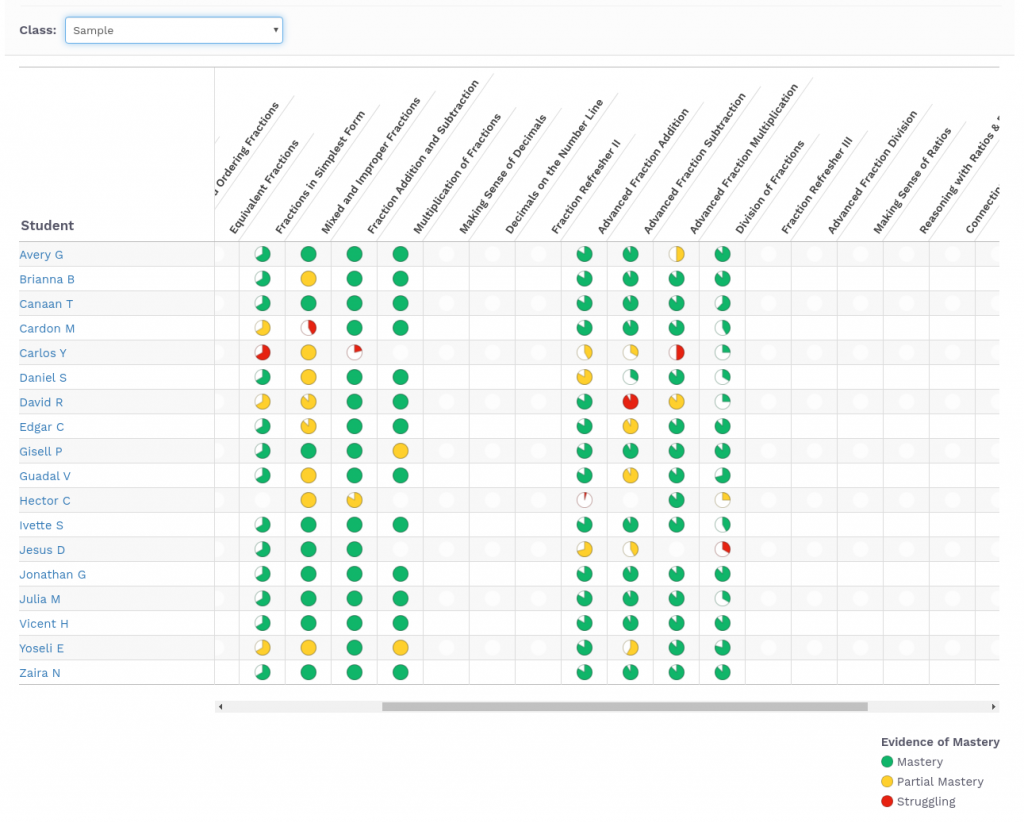
This report indicates two things using fraction pieces (because, we love fractions!) First, completion towards the assignment is shown as the amount of the fraction circle that is filled in. Second, the level of mastery (red, yellow, and green) are indicated for each assignment. You can click on a student’s name (shown on the left in the above image) to get a detailed reporting of the student’s progress, which includes the assignments and levels played, time spent, problems solved, and stars earned.

What do stars indicate?

As students complete levels within a given assignment, they are awarded stars. Students can earn between 0 and 3 stars for each level. If a student is struggling and earning 0 or 1 stars, the adaptive engine might provide the student with extra content, review content, supplemental content, and additional types of supports. For a student that is doing great and earning 2 or even 3 stars, the adaptive engine might determine that the student has mastered the content and that they are ready for additional material. Stars earned on an assignment influence the level of mastery reported, but it is not a 1:1 correlation.

What do the levels of mastery indicate?

The levels of mastery indicate how your students are doing on a given assignment. Because mastery is based on past history of the assignment as well as current achievement, you can loosely think of it as a moving average.  (It is more complicated than that, since it involves Bayesian analysis and Machine Learning. If you’d like to learn more, please visit our research page for additional information.)

What are best practices based on my students’ mastery levels?

In general, if your students are at a green level, no action is required. It means that they are exactly where they should be, learning the material and doing great. For students that indicate a mastery level of yellow or red, it is recommended to take a closer look at their reports.

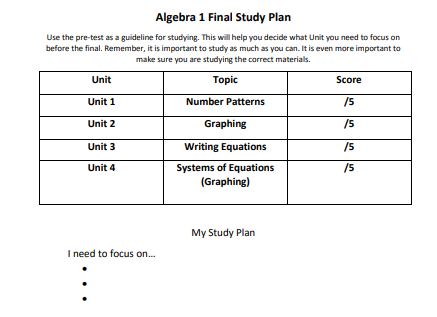
By clicking on the student’s name, you’ll see a detailed timeline of the student’s progress. Each level that the student has completed is shown, and includes the time that they spent in the level, the problems that they solved, if they got correct or incorrect answers, and even if they watched the videos or not. A sample of this timeline is shown below.

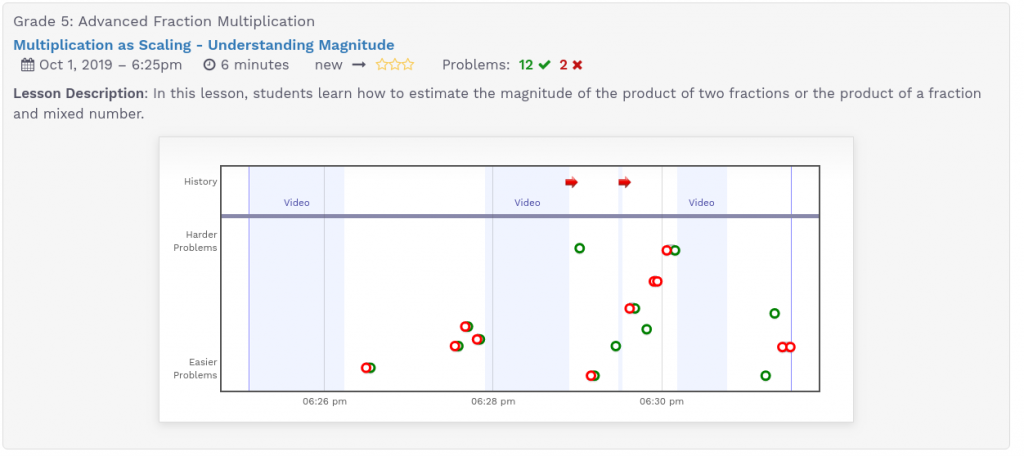
The videos displayed during the lesson are shown in blue, and if the student skipped a video, it is indicated with a red arrow at the top of the report. Problems answered correctly are indicated by the green circles, and incorrect problems are indicated with red circles.

Reviewing these problems, perhaps even with the student, can help address gaps in understanding, so your student can continue on making progress through the assignment.

If a student is consistently showing a red level of mastery, you might want to consider assigning the student earlier content in the sequence. Woot Math’s adaptive engine will not send a student back to an earlier assignment without input from their teacher. For additional details on best practices, refer to the implementation guidelines for grades 3-5 and 6-8.

Weekly Math Task: Daylight Savings Time Trivia

We created an activity to help your students learn about Daylight Savings Time. Students work on connected devices to answer Daylight Savings Time trivia and math questions. With all 7 questions this would be a great 25-30 minute activity. If that’s too long, you could cut the 5th and 7th problems and make it a 10 minute warm-up.

The activity starts with a simple question to remind them what Daylight Savings Time is. Students estimate how the spring time change will affect when the sun sets. This seemingly simple problem might be harder for some students than you think. You can always remind them that they are about to “spring forwards” because daylight savings time is about to begin.

Spring Forward

– Task 1: Spring Forward Fall Back –

The next task tells students that Daylight Savings Time lasts for 34 weeks. It asks them what percentage of the year this is. Some of your students may need a reminder that there are 52 weeks in the year. As a challenge, you could ask them how many days in the year and make them compute the number of weeks with the scratchpad calculator. It is always good to show your work; students make fewer errors and teachers can see their thought process. That’s why we encourage use of the scratchpad (plus, it is fun to share the student work with the class, and even ask for volunteers).

Task 3 presents some trivia relating to Daylight Savings Time. According to Wikipedia, it was first started as a way to save energy used on lighting. If the sun sets later in the day, people do not need to turn the lights on until later. The goal was to best align when people would be awake with when the sun would be up.

Daylight Savings Time History

– Task 3: Daylight Savings Time History –

Did you know that Arizona and Hawaii do not observe Daylight Savings Time? If you did then you could correctly answer the next task. Students are asked to tap one of the two states on the map that do not observe Daylight Savings Time. When you review this task, feel free to add in a fun anecdote about why Hawaii does not change their clocks. (Hint: they are closer to the equator, making their winter and summer sunset times more similar than in other states. Interesting!) So why not Arizona? You’ll have to read on because task 7 is about why Arizona doesn’t observe Daylight Savings Time.

The next task asks students to compare sunset times between Colorado and Arizona during daylight savings time. You may need to remind students that Daylight Savings Time happens during the summer. In the Winter, Colorado and Arizona both have the same time.

Task 6 explores the interesting fact that the Navajo Nation recognizes Daylight Savings Time while Arizona does not. During Daylight Savings Time, (spring through fall) the Navajo Nation has the same time as Utah, New Mexico and Colorado but a different time from Arizona. For this task, students are asked to sketch a route on the map to show where they would have to change the clock 5 times without turning around. To get 2 clock changes, students draw a line that goes from Arizona to the Navajo Nation (or one of the other states) and back to Arizona. They then need to do this again, ending with one final trip to the Navajo Nation. In the winter, the entire map is on Western Standard Time so there would not be any clock changes necessary.

map of the Navajo Nation

– Task 6: The Navajo Nation –

The final task encourages students to think critically about energy savings, climate and Daylight Savings Time. A fun piece of Daylight Savings Time trivia is that Arizona does not change their clocks in an effort to save energy. “Whoa? In task 3 we said Daylight Savings Time helped save energy, now you’re saying the opposite!” In Arizona, having an earlier sunset means natural cooling happens faster. This reduces the need for air conditioning in the evening. Since Arizona is so hot, lots of their energy goes towards cooling homes and businesses. This is less true in other places where it is not so hot in the day and cool at night.
Home Energy Use By Sector

– Task 7: Home Energy Use by Sector –

This task gets students thinking critically about how the timing of the sunset relates to home energy use. Students share ideas with a partner and one of them writes their answer on the scratchpad. There are also hints on the scratchpad.

We recommend this activity as a review of Daylight Savings Time or as a fun warm-up just before or after we change the clocks. To preview the activity, click the link below. Or, login to wootmath.com and search for “Daylight Savings Time” in the Shared Gallery.

Preview Daylight Savings Time Trivia

Visit our page on Formative Assessment for more on how to use this free tool in your classroom.

How to Use Woot Math to Prep Students for PARCC and CMAS

Of all topics in mathematics, students struggle the most with making sense of fractions and operating with them flexibly. Woot Math’s Adaptive Learning Content provides instructional (grades 3-7) and remediation support to help students conceptually understand and master key mathematics ideas. Students learn how to make connections among the various representations of rational numbers and use this thinking to solve problems involving fractions, decimals, rates, ratios, proportional thinking, as well as operations involving integers.

PRACTICE + VISIBILITY INTO STUDENT WORK

Woot Math provides full practice tests that are aligned to PARCC and CMAS. These interactive modules are designed to mimic the testing environments students will experience. If you want to use this resource as a practice exam, we recommend assigning it as self-paced so you can formatively assess your students’ knowledge.

Click below to demo a practice test as a student. From Woot Math’s gallery of content, search for PARCC and CMAS to view a complete list of modules available.

Alternatively, you can use this content in a teacher-led mode to monitor the strategies used by all of your students and use this information to facilitate a classroom discussion. If you want to make changes or additions to the tasks, Woot Math makes it easy for teachers to edit the content directly.

These tools are available on Woot Math at no cost, and are designed to support authentic formative assessment and give visibility into student’s understanding.

For an overview on the positive impact that authentic formative assessment has on student learning, see this article by Dr. David C. Webb, an Associate Professor of Mathematics Education at the University of Colorado Boulder and the Executive Director of the Freudenthal Institute USA.

ADAPTIVE PREP + FOUNDATION MATH SKILLS

For your elementary and middle school students who struggle with fractions, rational numbers and rate and proportion, Woot Math’s adaptive learning modules can help increase their confidence, improve conceptual understanding, and procedural fluency. 

Click on the Number Line Demo to experience a sample adaptive unit about number lines as a student.

To learn more about how Woot Math is being effectively used in the classroom, here are two helpful guest posts that were written by teachers:

RESEARCH & EFFICACY

Woot Math is a research-backed platform; our research has been funded by the National Science Foundation, the U.S. Department of Education, and the Bill and Melinda Gates Foundation. This funding has enabled us to develop a program that has demonstrated efficacy and effectiveness in many different schools from across the country, including schools in Colorado. Our research and development work has resulted in a product that is proven to help students develop confidence and fluency with rational numbers.

In addition to our own research, Woot Math leverages decades of research and synthesis about how students learn mathematics and how certain topics (like rational numbers) might best be taught. We work closely with the Rational Number Project (a multi-university, 30+ year effort that has thoroughly studied how students might best learn rational numbers), other leading researchers, and a bevy of classroom teachers. Our tools help to bring the best available practices to every classroom and do so with a unique focus on hands-on modeling.

Questions? Comments? We would value hearing from you.

How to Use Woot Math to Help with Final Preparation

How to Use Woot Math to Help with Final Preparation

Students are constantly struggling with study skills, especially in 9th grade as we start to think about end of year testing. It is difficult to “know where to start,” which is fair, considering there is a lot of material to cover! They are overwhelmed by the information and are still learning how to manage their time.

I was hoping to relieve some of this stress by creating personalized study plans for each student. I know, I know, a lot of you are rolling your eyes thinking, “How will I have time to do this?!” Using Woot Math and a quick worksheet, I was able to make study plans for all three sections of Algebra 1, on the spot, during a 45 minute class period. I know, it is very hard to believe.

In my Algebra 1 classroom, I start preparation by gauging students knowledge. What do my students need to know to be successful? Where are they struggling? What have they mastered? I answer all of these questions with a pre-test using Woot Math! If you want to check it out right away, click the link below. Continue reading to see how I use the poll.

My final is separated into four distinctive units: number patterns, graphing, writing equations, and systems of equations. I took five key questions from each unit and created a set of twenty questions. In class, I had all of the students work on the poll using the “self-pace” feature with automatic feedback turned on. You can see my student’s results below.

woot-math-alg1-review

Once students have completed their poll, they sit with me and we analyze their results using the results page shown above. I quickly count how many they got correct out of the five questions per unit and calculate their scores. Then, working together with me we create their own personalized study plan. I made this very quickly using a word processor.

alg-1-test-plan

I have used study plans in the past and students respond very well to them, and they continually request them. Parents are thankful that their students have a plan of attack to be successful during finals. Special education teachers are grateful for the guidance, not only for the students but for themselves! This allows students to clearly understand where their skills are lacking and where they shine. Also, meeting with students one-on-one to check in before finals is a great way to instill confidence in your students.

This structure knows no limits! Whether you are teaching math, history, science, you could use this as a tool for your classroom! You can add reflective questions to the study plans to encourage students to think about their goals and not just memorize formulas.

How do you prepare your students for finals? Do you let them run free and learn study skills on their own? Or do you have an awesome game that you play? Whatever it is, we at Woot Math would love to hear about it! Good luck studying! Woot! Woot!

About Diana:
Diana Rapp is a full-time math teacher at Fairview High School. She has been a mathematics teacher for two years. Growing up, Diana struggled in mathematics. She learned quickly at a young age that she would have to work hard and productively struggle constantly in order to be successful. Along her journey as a student she was lucky enough to have incredible teachers and tutors that gave her the tools to succeed and instill confidence in herself. Diana became a teacher because she believes she can be that mentor for her struggling students. Diana has a BA in Mathematics and is currently working on her Masters in Mathematics Education Curriculum and Instruction.

Study Time – Fun with Statistics

Task #1

The activity starts with a tap-an-image problem. Students tap the outlier in the data.
 
Task 1: Tap the Outlier

– Task 1: Tap the Outlier –

This is a good refresher if your students are familiar with the concept of an outlier. If they aren’t, it is a good opportunity for instruction. I recommend lingering a little on the context here. Discussing what the data means primes a discussion about hard work and a growth mindset. Although the data is not real, it helps students understand what an outlier could be in a real world context.

Task #2

Task 2 is a review of different types of correlation. We thought it was a weak correlation. Since there is only one outlier, some students may argue that it is strong correlation. After your students submit a response, you can have a discussion by de-selecting the “Reveal Answer” option. Then you can view and discuss the results of the class without revealing the right answer. You can also press the “Assign Groups” button to automatically create groups for small-group discussion.
 

– Assign Groups Feature –

Task #3 and #4

Tasks 3 and 4 both provide an equation of a line representing best fit, and students are asked to determine a test score given study time. They also highlight an interesting feature of the short answer task type. While designing a task, you can set it to accept equivalent forms of the correct answer. Click on the gear icon to set the various equivalence options.


– Edit Equivalence Options –

For this task we turned off operations because an answer of 0.1*3+0.5 doesn’t seem like they have quite figured it out yet. If operations were on, the tool would accept 0.1*3+0.5 as a correct answer. We left fractions on because converting 0.8 to a fraction is helpful extra practice. There’s nothing wrong with that.

– Task #3: Accepted Answers –

In the answer blank you can also separate multiple correct answers with a semicolon. As long as the number comes first, the software will give you access to the equivalence tools. If you do a letter or word first, it will treat the answer as a string and let you change the number of typos allowed. The way we have the answer box setup, it will accept responses of 0.8, 80%, B- or any fractional equivalent to 0.8. This way your students will not get it wrong if they think outside the box, interpreting a grade of 0.8 as a B-.

Get started by previewing the poll right now with the link below. Or, login to wootmath.com and search for Study Time in the Shared Gallery.

Visit our page on formative assessment for more strategies on implementing ideas like this in your classroom.

Weekly Math Poll – Systems of Inequality

Task #1
The context of the problem is a business that makes hats, both by machine and by hand. In the first problem, students need to model an inequality between their budget, $2000, and the cost of making each type of hat. Often students don’t know where to start with word problems, so this task provides some supports in the scratchpad. If you think your students don’t need the extra support, feel free to remove it by clicking on scratchpad settings after you have copied the task into your account.

Student view of task with scratchpad

Task #2
The next problem is another opportunity for them to model an inequality from a word problem. Some students may be able to intuitively see that if over 50% are made by hand then y>x. Others will need some help, so the scratchpad has some steps to get them working. When reviewing the problem with the class, you can always use this pre-saved bookmark called “Great Work!” (Note: you can access bookmarks by clicking on the “Bookmarks” tab when viewing results.)

Task #2 with steps illustrated on the scratchpad

Notice how the scratchpad helped the student get started with writing down what they know, then putting it together to solve the problem. If students write the final answer as y/(y+x)>0.5 (or any variation of it) they will get it right, make sure you go over that this is the same as y>x before the next problem.

Task #3
This is a great example of how you can spice up a multiple choice question. There is a pre-made graph and a blank table on the scratchpad to help them connect different representations of y>x.

Scratchpad with different representations of y>x

Task #4
This problem has the inequality from task 3 on the scratchpad. The major advantage of this is even if your students got it wrong in task 3, they won’t be building off a mistake moving forward. If you are running a teacher led poll, they won’t be able to look ahead. This task is harder than the last one, remember to remind them to use a table or plot some points. If you want, you can always add hints on the scratchpad by going to “Scratchpad Setting” when editing the task.

Scratchpad with inequality from previous task on the scratchpad

The final problem gives them practice with testing points in a system of inequalities while remembering the parameters of the original problem. Students are given a graph of the system of inequalities to help them draw connections between different representations. Remind them as they work that they can draw on the graph (using the scratchpad) to plot points and see which of the shaded regions they are in.

Get started by previewing the poll right now, or login to wootmath.com and search for Systems of Inequality in the Shared Gallery.

Visit the page on Formative Assessment for more information on implementing these strategies in your classroom.

Weekly Math Poll – Fun with Factoring for Middle School

This Woot Math Poll was created by Marilyn. Thanks for sharing! To preview these excellent questions (there are 15 in total), run the poll now:

We’ve highlighed just a few fun questions. How would your students do on these?

Sample Task #1
This question asks the student to tap on any of the prime numbers shown below. You can use the Tap an Image task to make interactive tasks such as this – just upload any image and then color in the correct answer(s).

Tap on any prime number

Sample Task #2
This problem asks students to find a square number between 30 and 50. Students can use the scratchpad and the expression editor to show their work. A fun follow-up question – how many square numbers are there between 30 and 50!

Find a square number between 30 and 50

Sample Task #3
This question is a great review of mathematical vocabulary.

Modify for Your Classroom

You can use this poll as a warm up, quiz, or even homework. Or, you can copy and then modify it to meet your needs. There are lots of excellent ideas to leverage for your classroom. With Woot Math, all of the polls are completely free and great Open Educational Resources (OER).

Get started by previewing the poll right now, or login to wootmath.com and search for Prime Time Investigation in the Shared Gallery.

Visit our page on Formative Assessment for more information on implementing these strategies in your classroom.

Stay tuned for next week’s poll!

Happy Pi Day 3.14 – Quizzes & Resources

Pi Day celebrates the mathematical constant (π), as March 14 can also be expressed as 3.14, the first three digits of pi. Pi is the ratio of a circle’s circumference to its diameter, which is a constant. That is – for any size circle, the ratio is the same (π).

Happy Pi Day


The first large-scale celebration of Pi Day was organized by Larry Shaw at the San Francisco Exploratorium, where Shaw worked as a physicist. Then in March 2009, Pi Day became a national holiday in the United States. And a fun note? March 14th is also Albert Einstein’s birthday. Don’t worry, unlike Pi, this history lesson won’t go on forever. Onto the math!

Use these two warm-ups or exit tickets
for fun with square roots (and of course Pi):

Evaluating Square Roots    circumference warm-up

These two warm-ups can be used for a quick check
of student understanding with trigonometric expressions:

Evaluating cosine    special-right-triangles-in-unit-circle

And this is a great quiz for gauging
student understanding of arc length and sector area:

Arc length sector area quiz

You can run any of these as a warm-up, quiz or even assign for homework. You can also copy and modify the questions and make them your own. There are lots of excellent ideas to leverage for your classroom. With Woot Math, all of the polls are completely free and a great Open Educational Resources (OER).

Get started by clicking on any of the polls now to preview them, or login to wootmath.com and search by name. You can also click on the categories in the Shared Gallery – for example– GeometryTrigonometry, to find more great resources for your classroom. And who knows, you might also have fun with pie charts, or even pumpkin pie.