WeeklyMath Poll – Hybrid Car
- By Woot Math
- January 12, 2018
- 12:36 pm
- No Comments
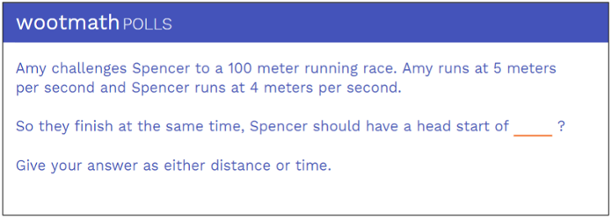
Task #1
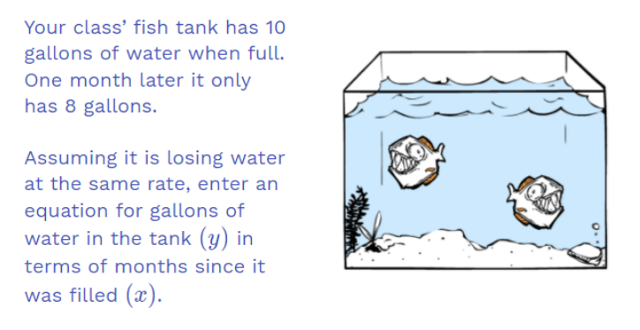
The first task presents a word problem with two data points, one where the tank has a full 10 gallons and one where it has 8 gallons a month later.
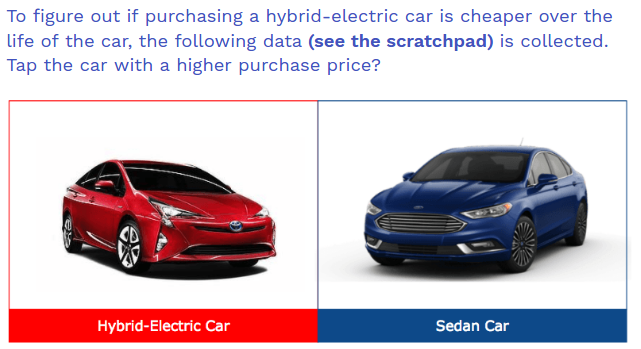
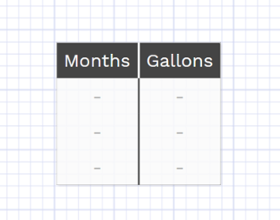
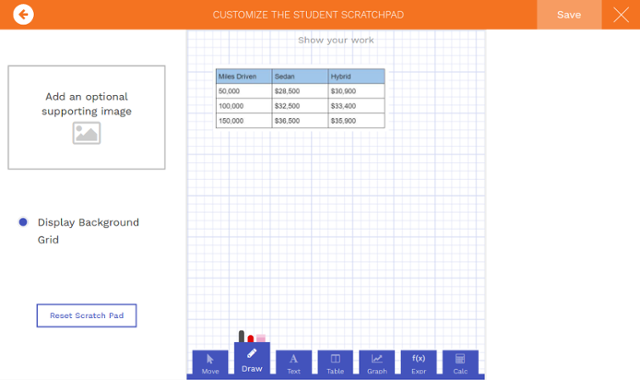
The first task asks us to compute which car has a lower purchase price. In the scratchpad, I have pasted a picture of a table of values relating to lifetime cost and miles driven. Students can draw on this table or use any of the scratchpad features to compute the cost at 0 miles driven.
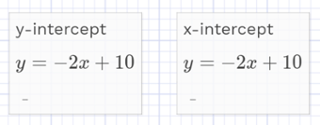
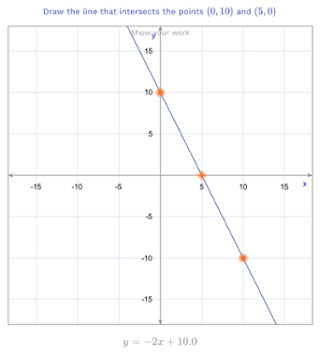
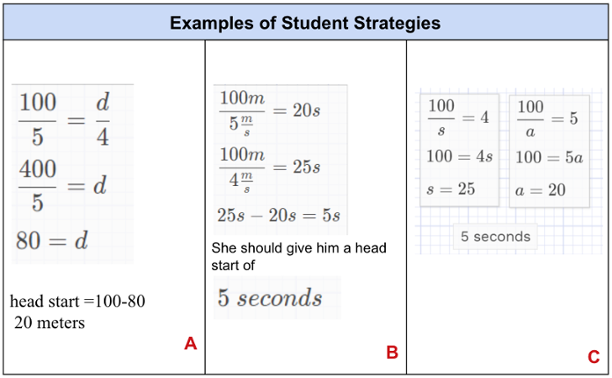
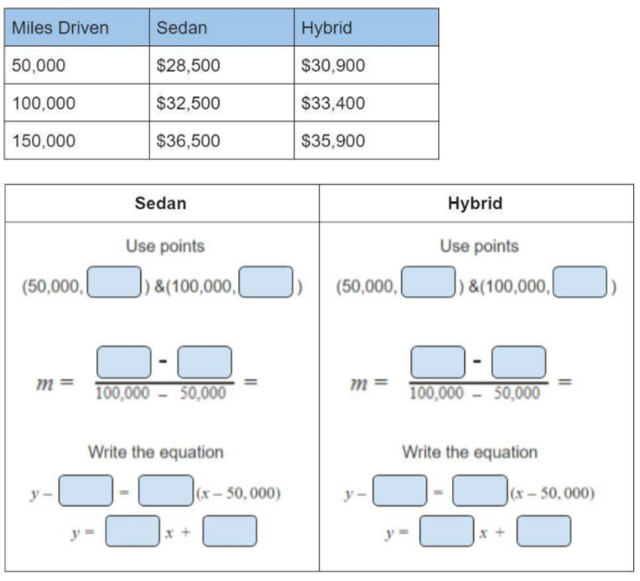
Task #2
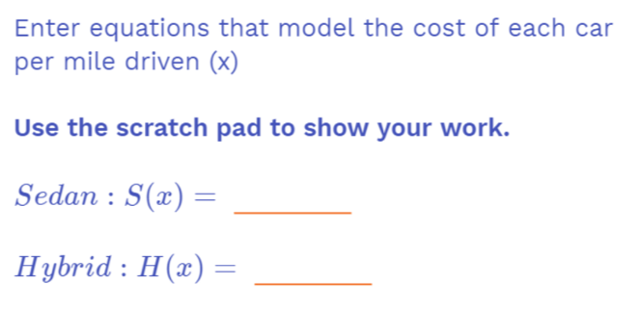
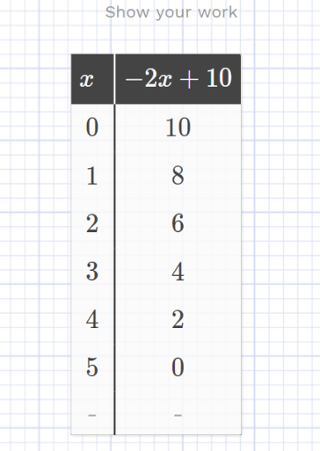
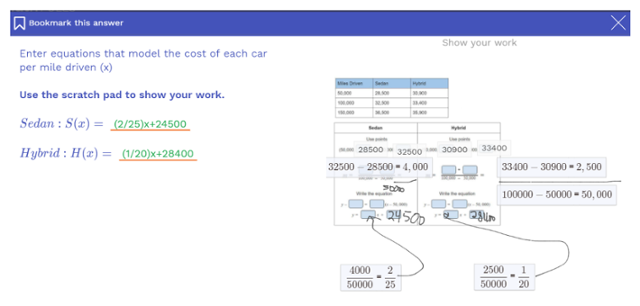
The scratchpad provides helpful support here in the form of a guided worksheet. Students can fill in the blank like they would in a workbook but now the answers are recorded digitally for you to analyze and organize. If you have students that want to solve it a different way or if they need more space, they can always move or delete the images. If you want use guided worksheets while making your own task, all you need to do is take a picture or scan of a worksheet and upload it in the scratchpad for your task.
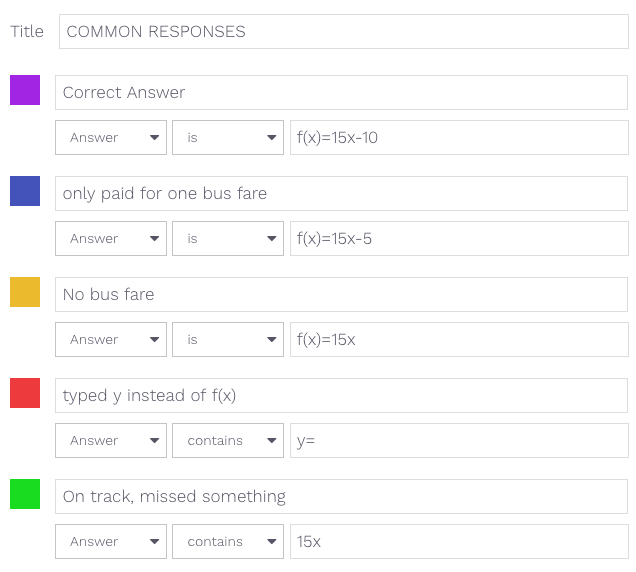
If you are worried that your students might not be filling out the worksheet and just peeking at their neighbor’s screen or using other unsanctioned resources, you can always sort responses by work shown. In the example below, four students did not show any work and two of them still got it right, suggesting it might be worth following up with them after class.
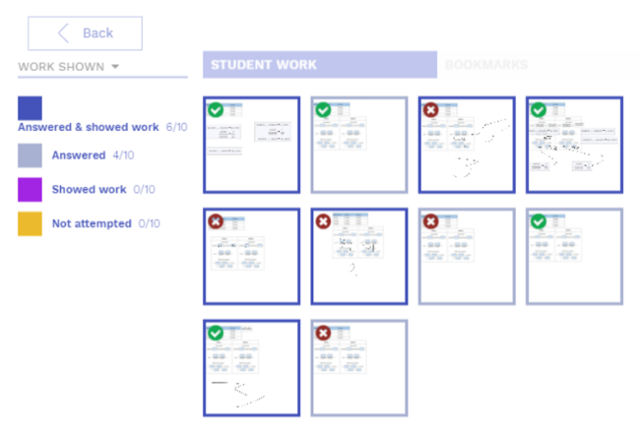
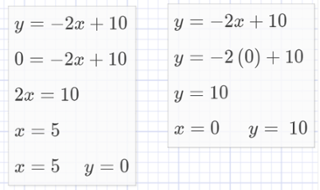
For the students who got the task right and showed work, if any of them did a particularly nice job showing their work, you can pull up their response as an exemplar to show the class. You can even save it in the bookmarks (upper left) to show other classes in the future when you run this poll. Notice how this anonymous student used the text editor, the calculator feature and the drawing tool to show their work.
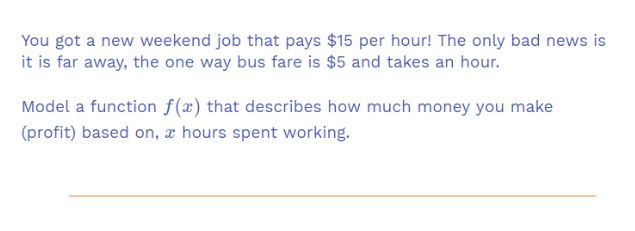
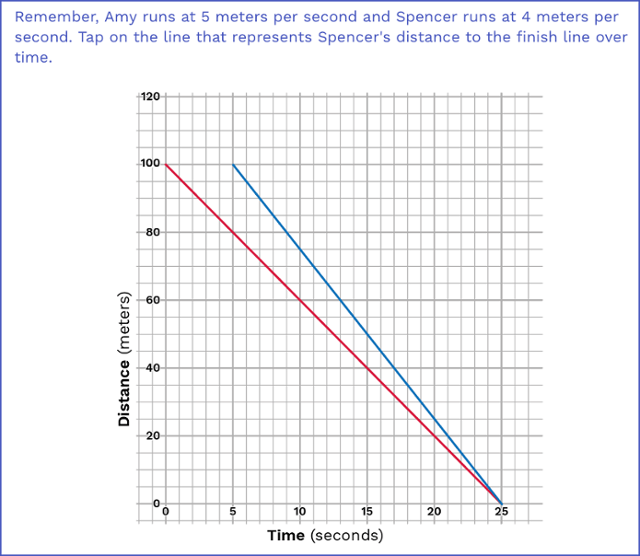
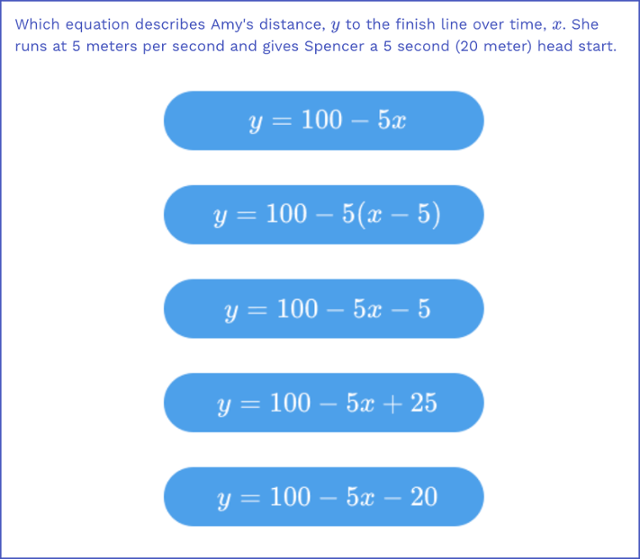
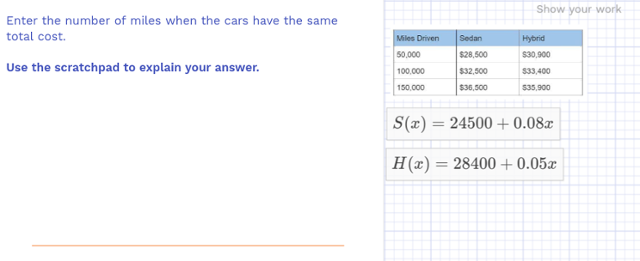
Task #3
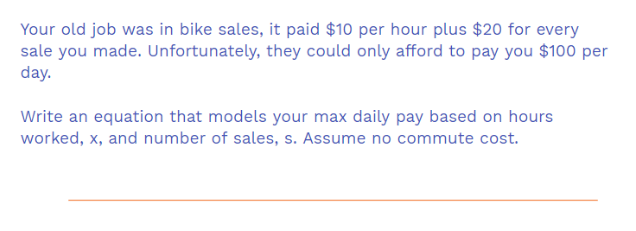
The third and final task in this poll shows how we can use the scratchpad to hold more information like the answer to a previous problem that is used in a subsequent problem. For a teacher led poll, students will not see these equations until after everyone is done with task 2. Note that if you run this poll in student-led mode with the “students see results” set to never, students could go back on their own and change their response.
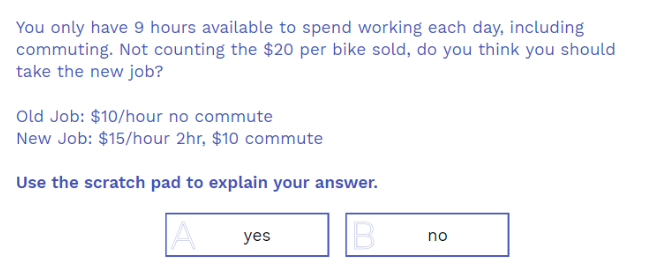
This poll ends with a question asking them to self evaluate how confident they are in this material, this is a great way to check in and gauge your students while also giving them a valuable opportunity to self evaluate.
This poll helps give some structure to modeling a linear relationship from a word problem and solving a system of linear equations. The scratchpad can help scaffold student work while also providing useful data for you on how they are working through each problem. This scratchpad feature turns polls turn into digital worksheets where students are guided through the intermediate steps. Stay tuned for next week’s math poll where we discuss some exciting new scratchpad features!
As always, we encourage you to modify these tasks and content to align them with your instructional goals. Copy the poll, modify or delete any task, or add new tasks. Please reach out with any questions or comments, we’re here to support you!
Get started by previewing the WootPoll right now, or login to wootmath.com and search for the Hybrid poll in the Shared Gallery.
Visit our page on Formative Assessment for more information on implementing these strategies in your classroom.
Stay tuned for next week’s poll!